Are we on pace for the month?
The Performance page opens on the month so far: store revenue, orders, AOV, new customers, ad spend, MER, new-customer CAC and email share of revenue, each against last period and, where you’ve set one, its target. One chart puts revenue, ad spend and the target line together.
14 days free. A card is needed to start, and nothing is charged until the trial ends.
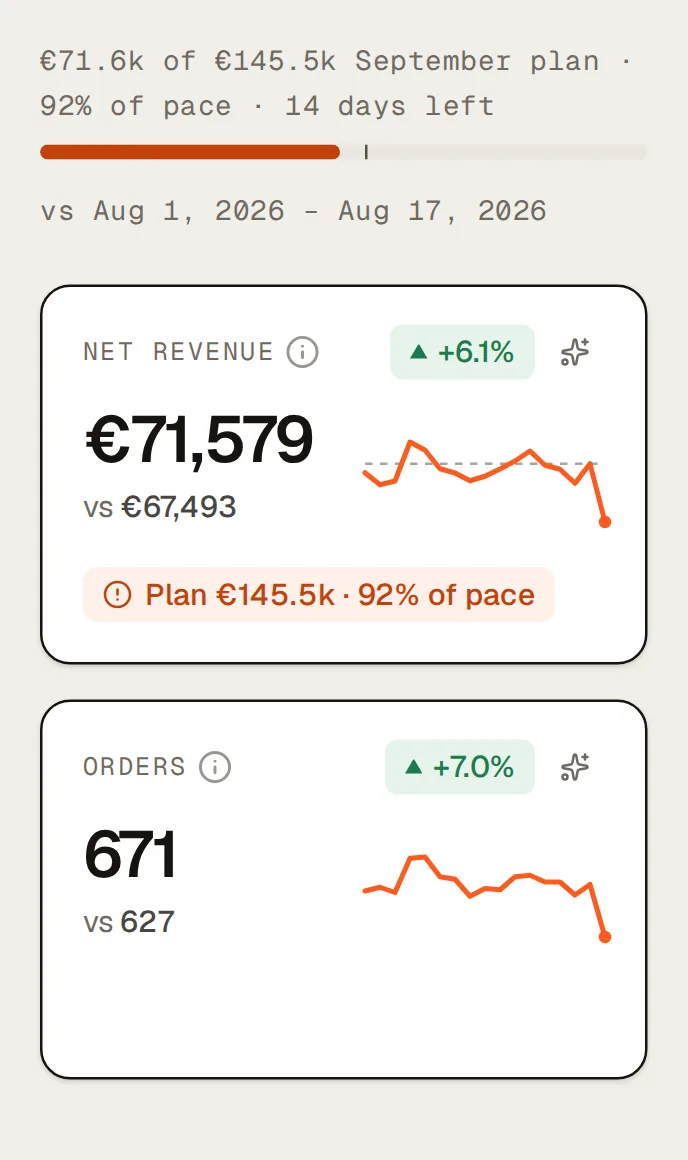
Pace to month, for every target
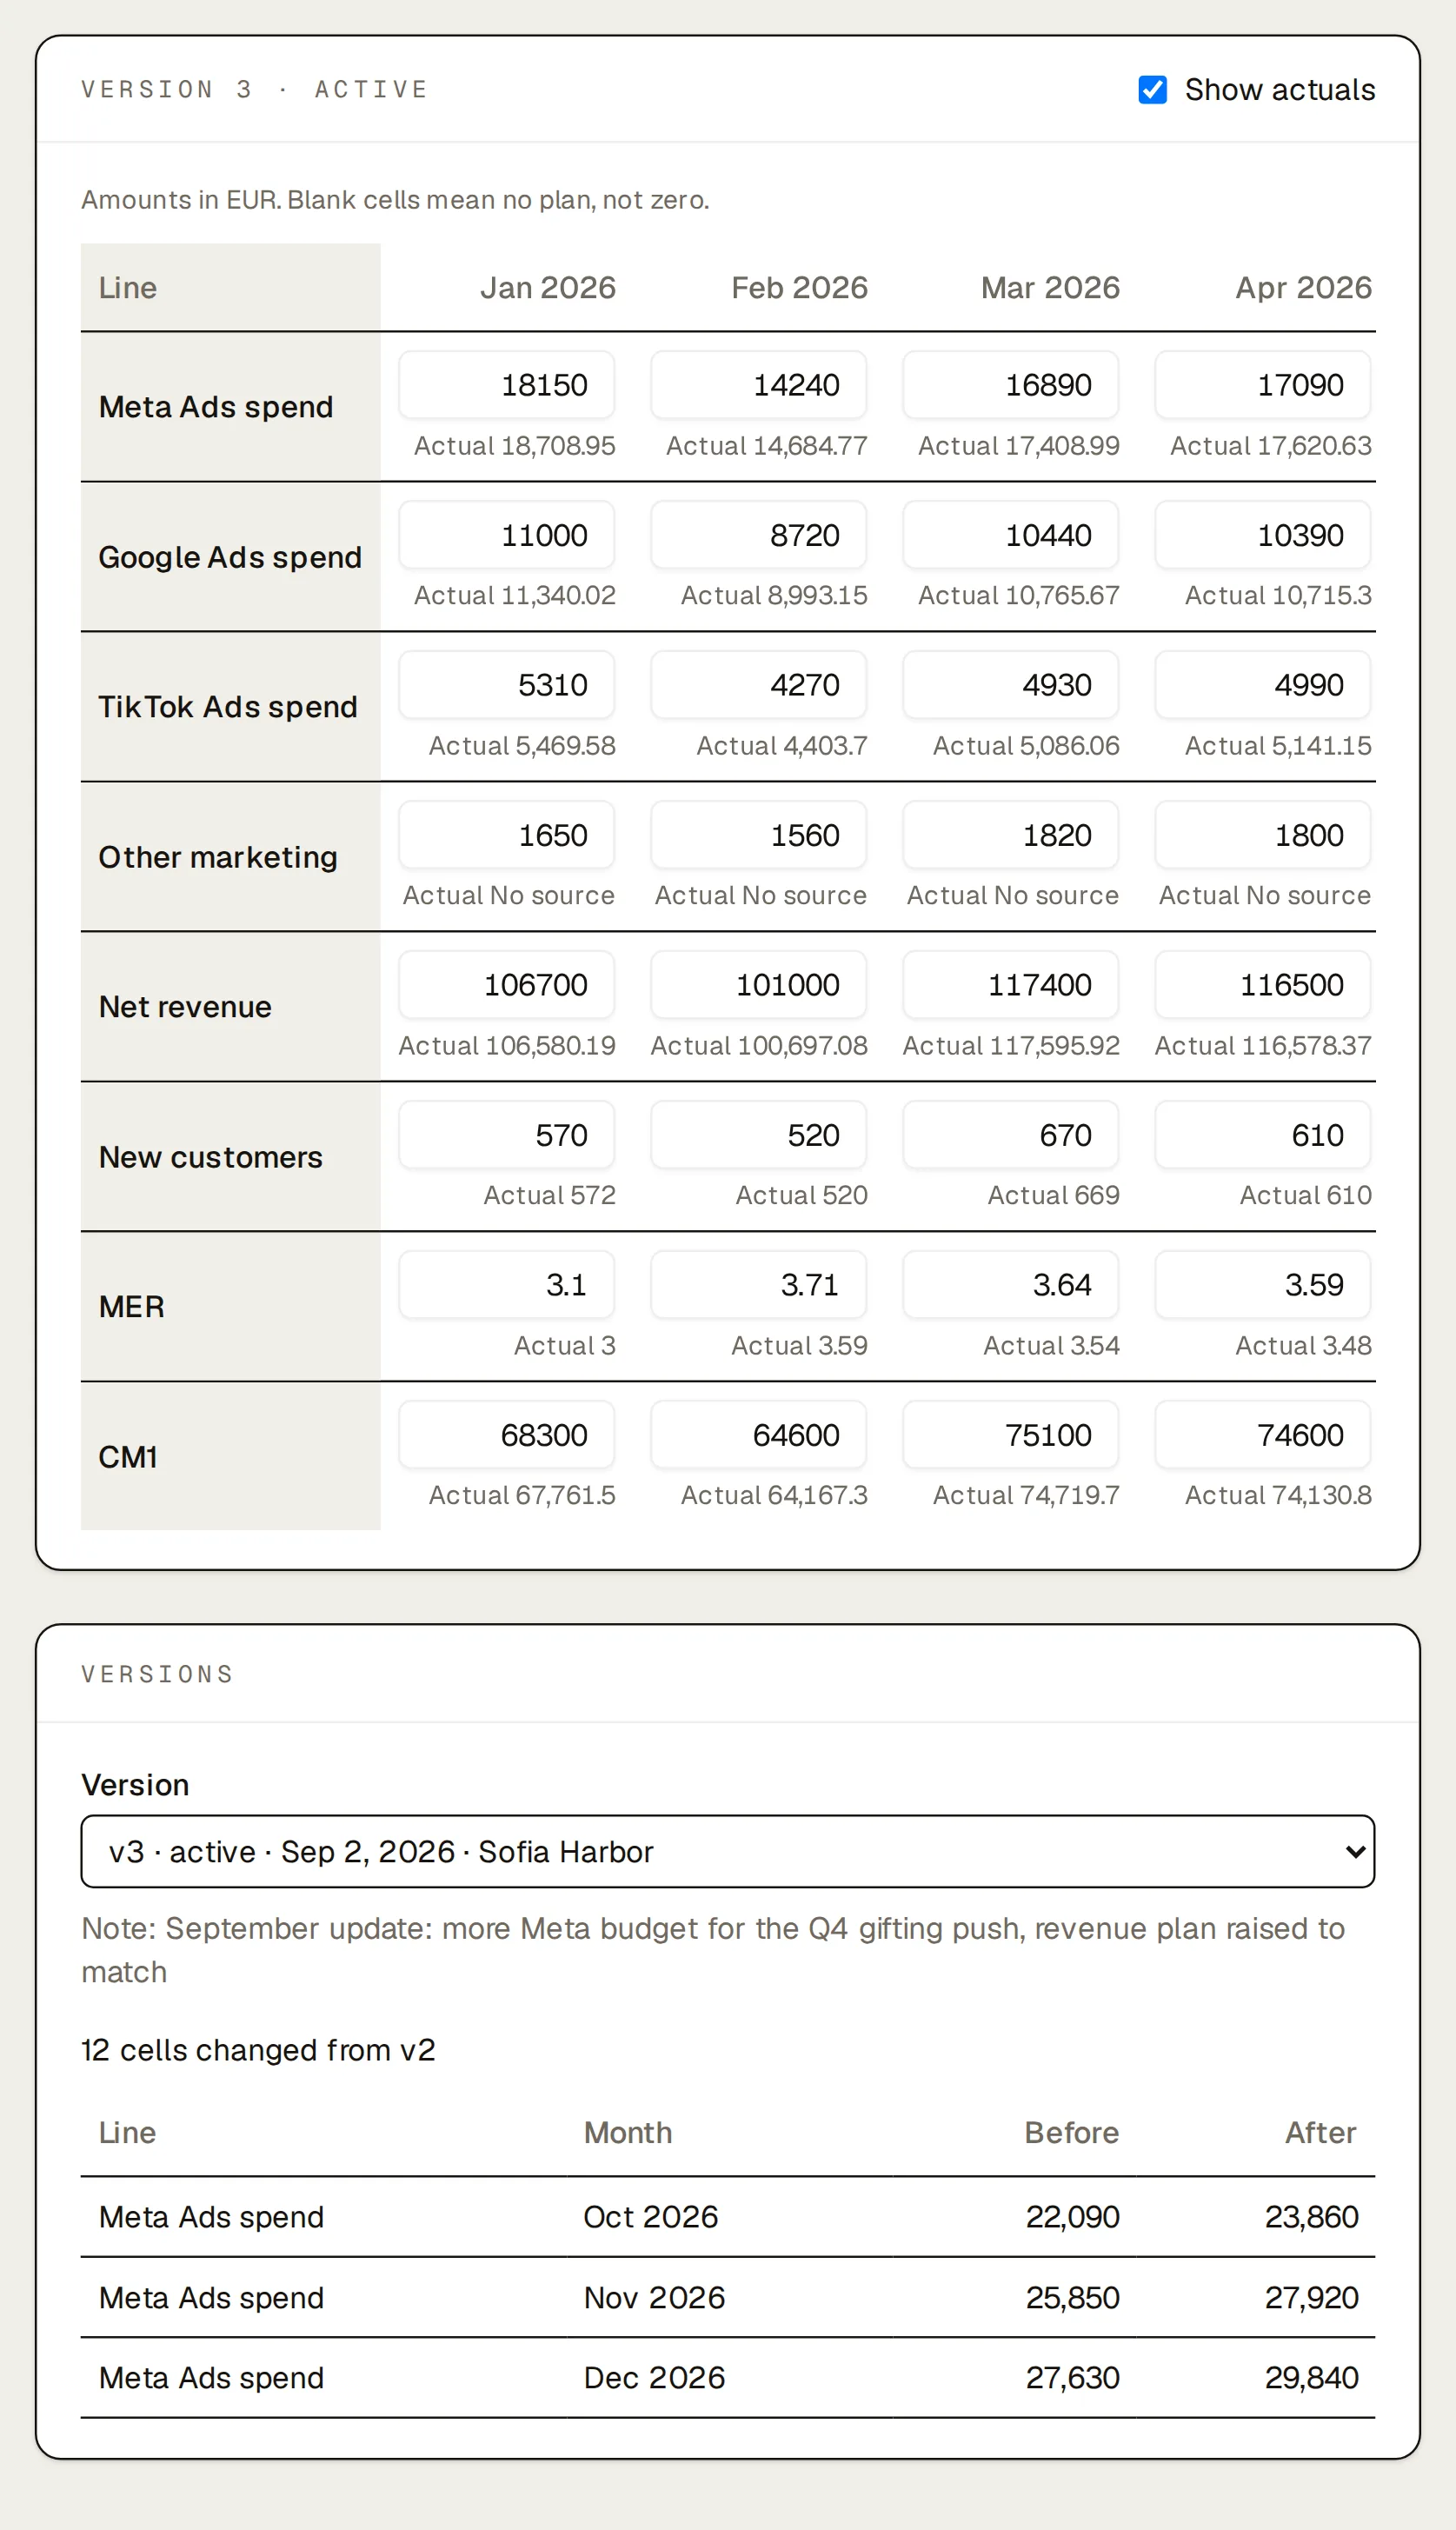
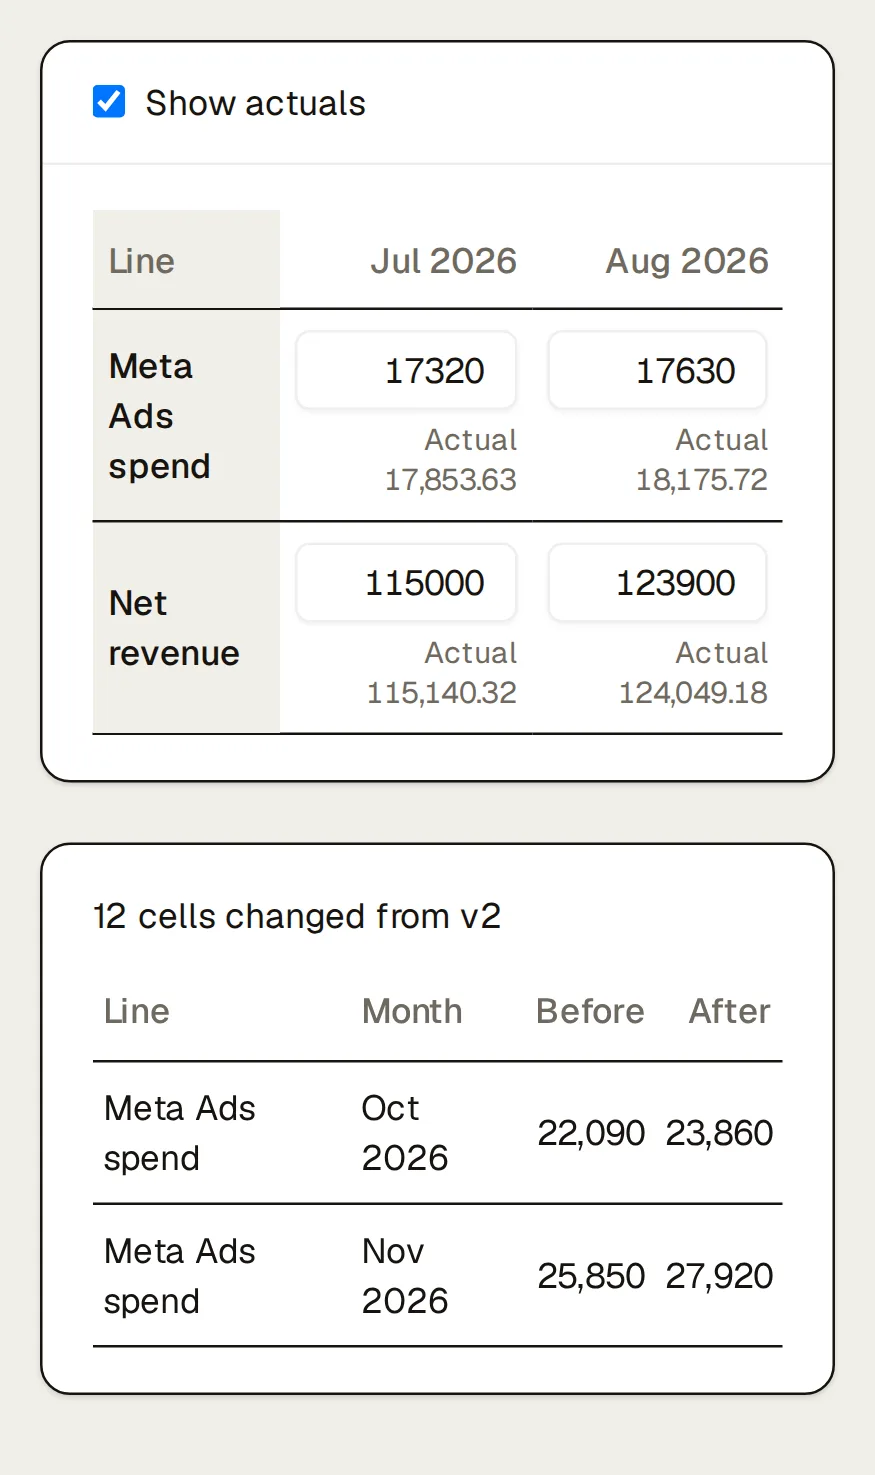
Set monthly targets once: store revenue, ad budget, MER, new customers, new-customer CAC and contribution after ads. Kreel paces each one month to date on a straight line through yesterday and marks where it stands: behind, on pace or ahead for revenue and new customers, within or over for the ad budget, met or missed for MER and CAC. It also tells you how much revenue a day you need for the rest of the month (“To reach €145,500: €5,280 / day for the 14 days left in September”). If you’ve planned the year in a budget plan, pace follows the plan instead. The plan is a 12-month grid you can paste in from a spreadsheet. Each save becomes a new version, and “Show actuals” puts each month’s result under its plan.
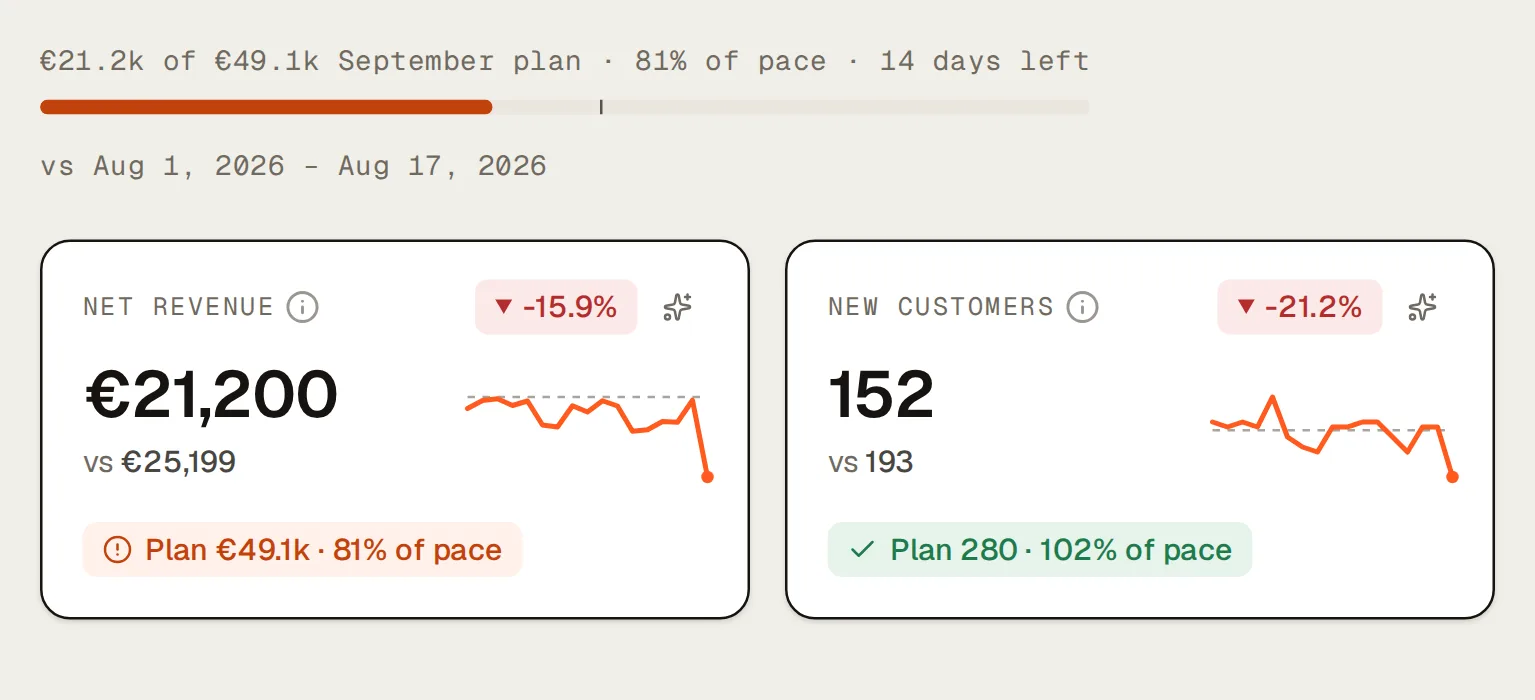
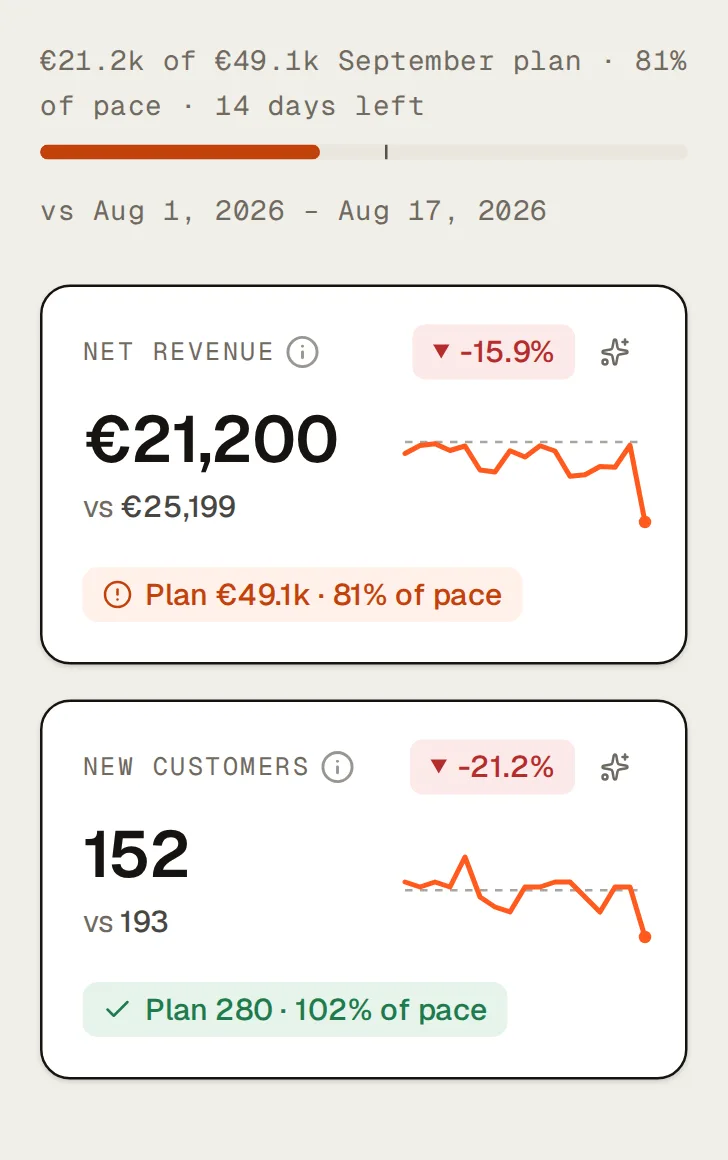
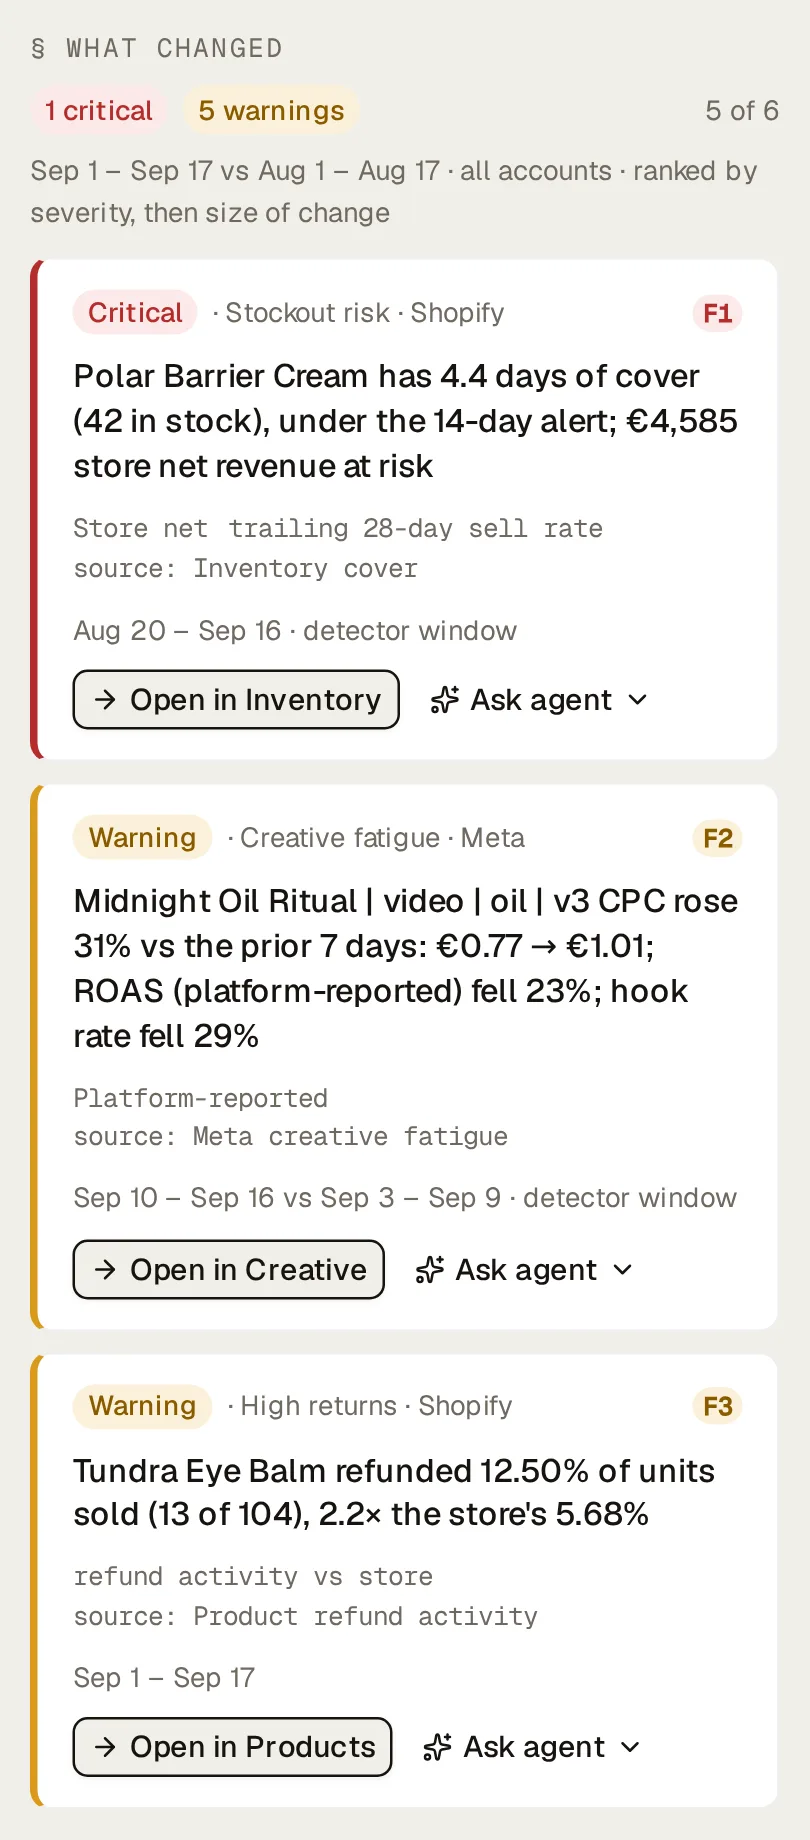
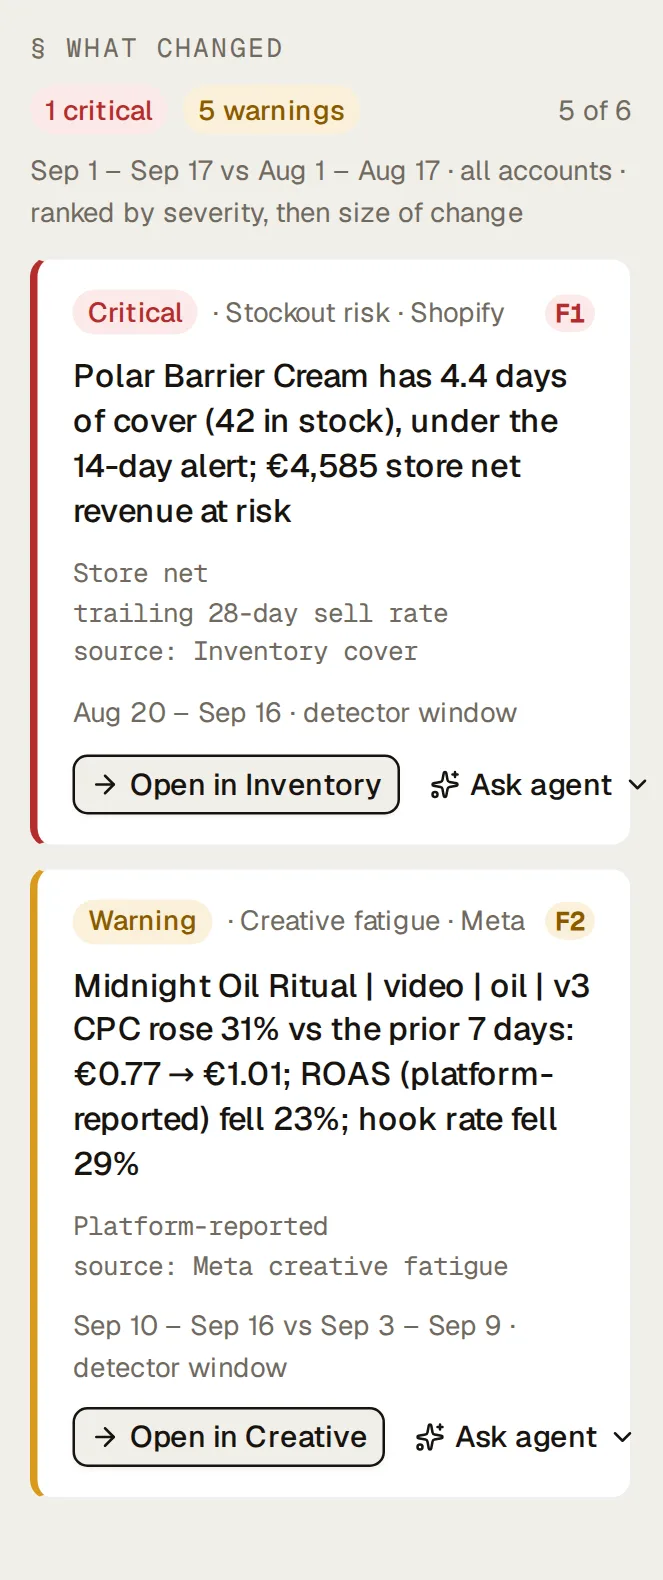
What changed since last week, in plain sentences
Beside the numbers, a rail lists what moved in the period: a campaign whose spend or ROAS swung against its baseline, a product close to selling out, a return rate far above the store average, a Meta ad wearing out, an email send whose bounce rate jumped, an ad platform running over its budget plan. Each finding says what it compared against, and “Show me” takes you to the row. Switch on alerts and new findings go to Slack, and critical ones to email, once a day.
Contribution after ads, month by month
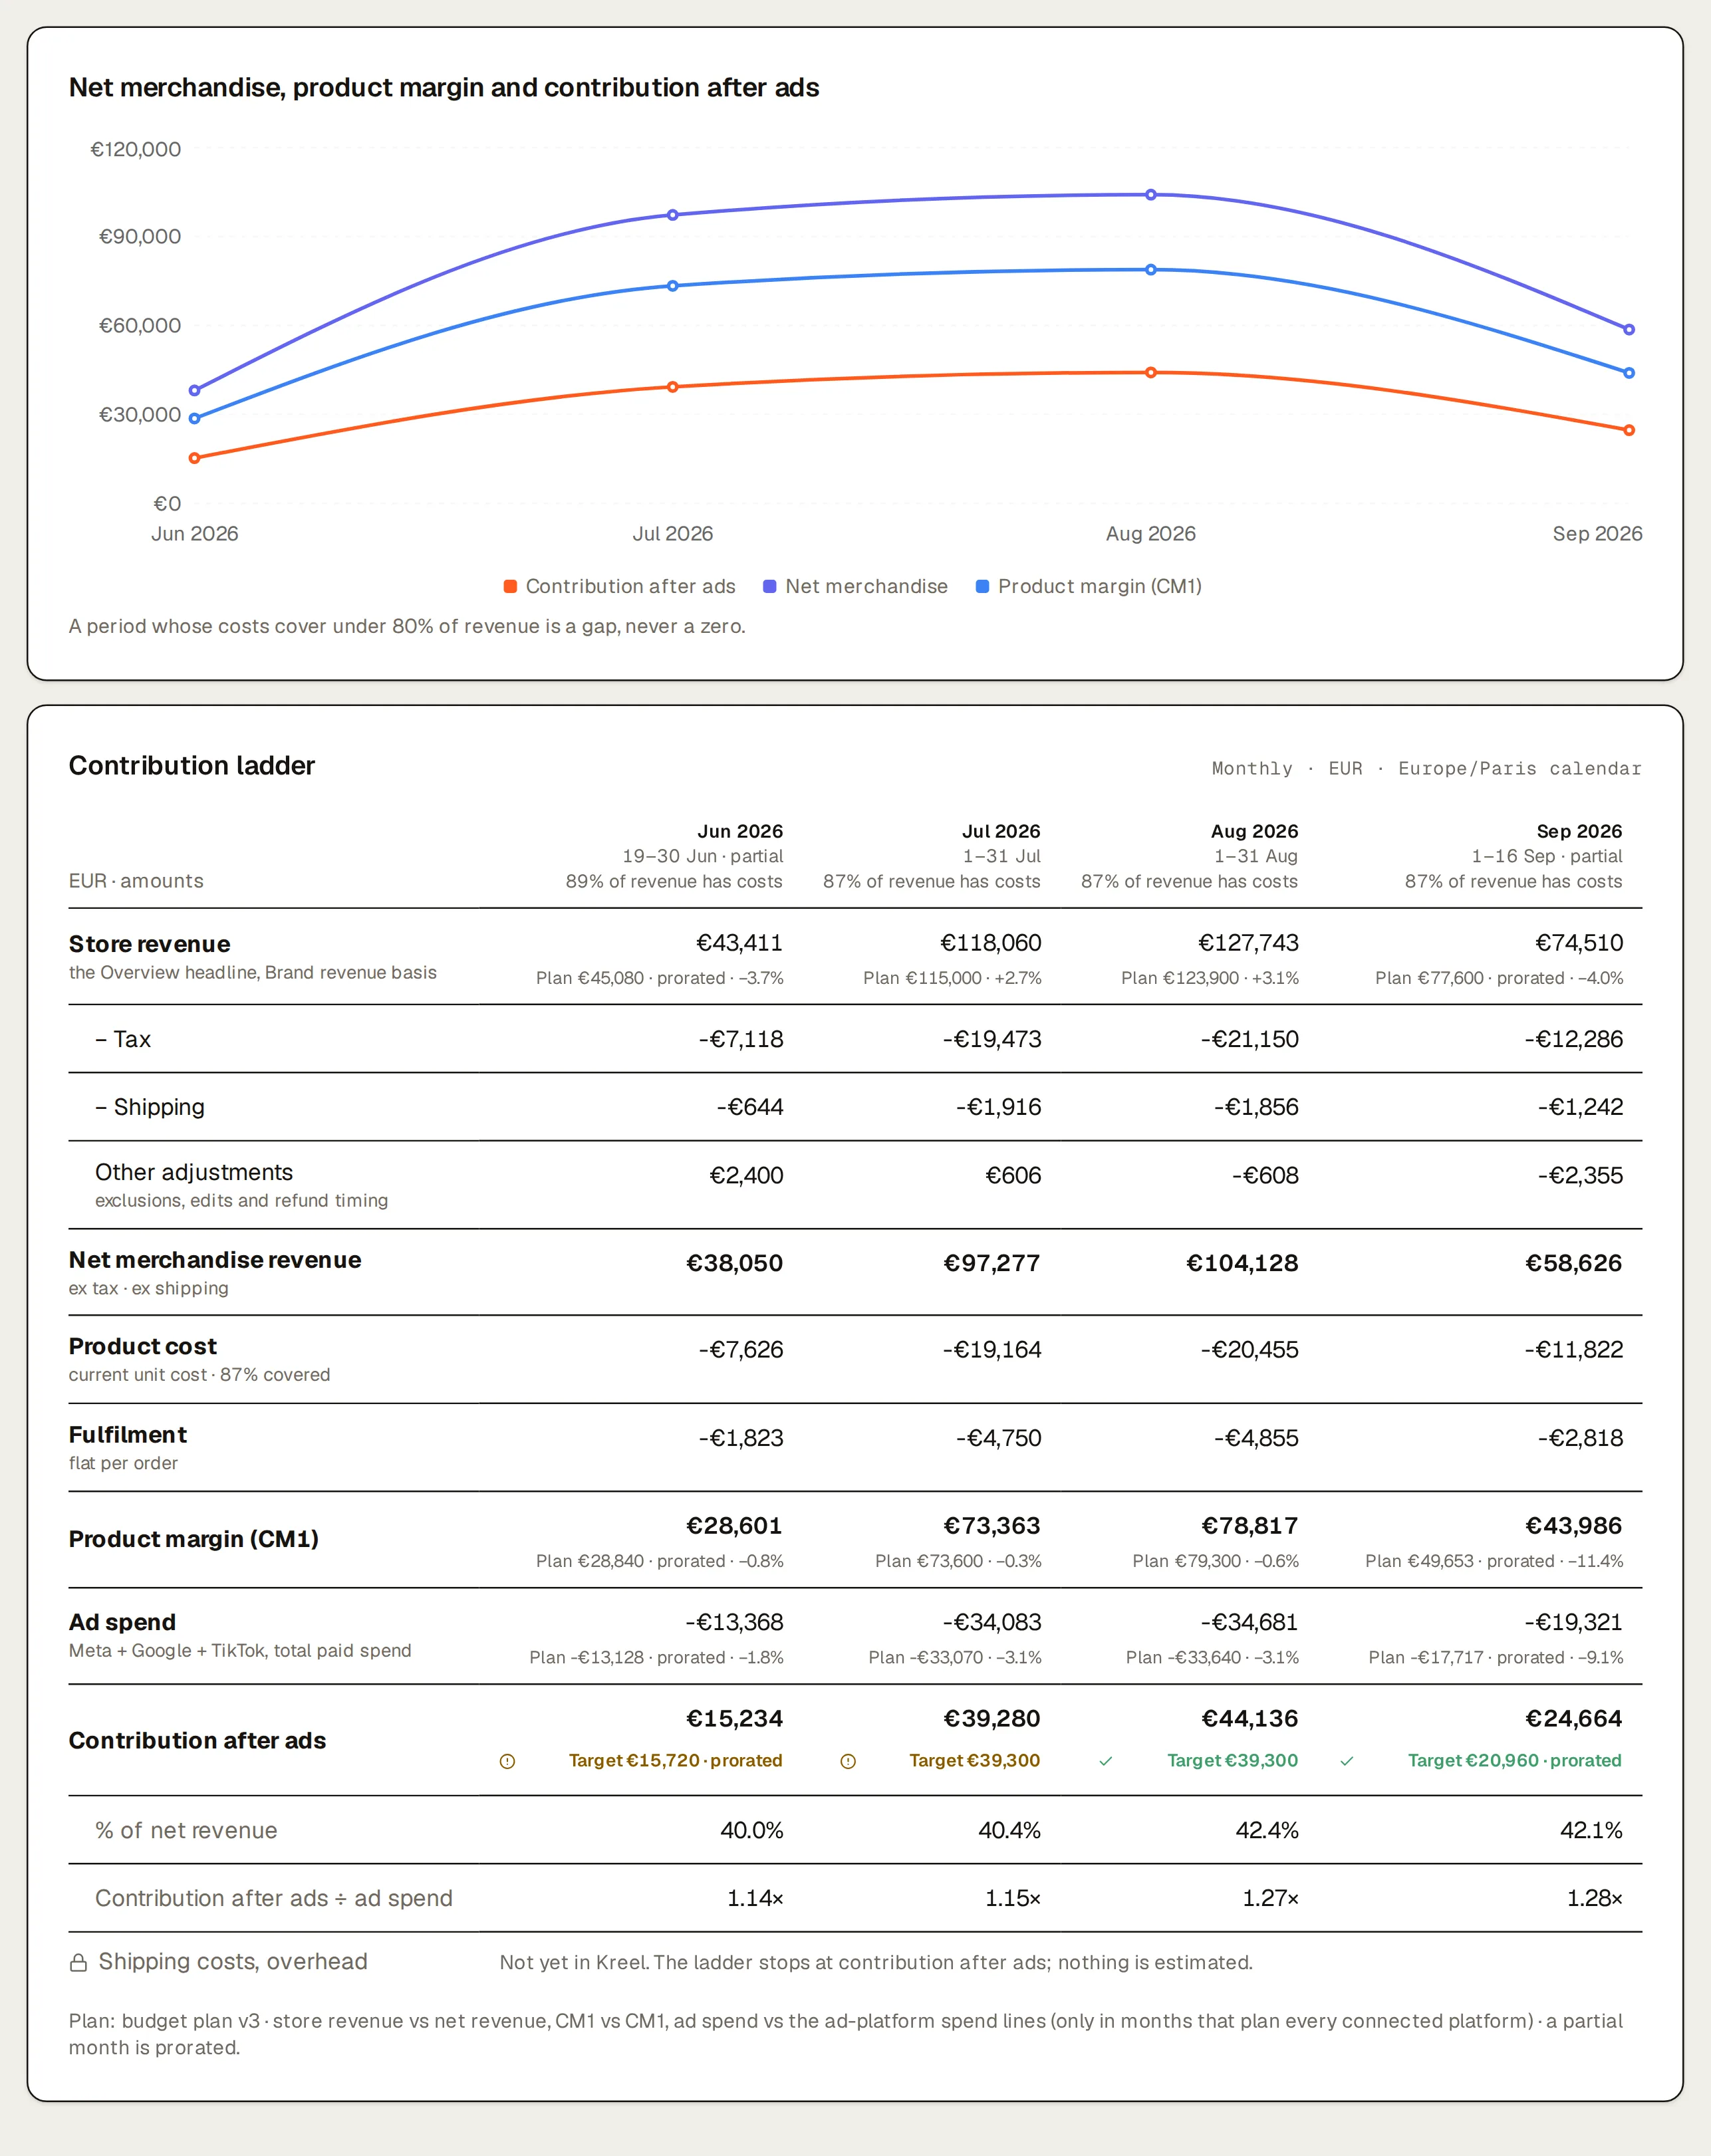
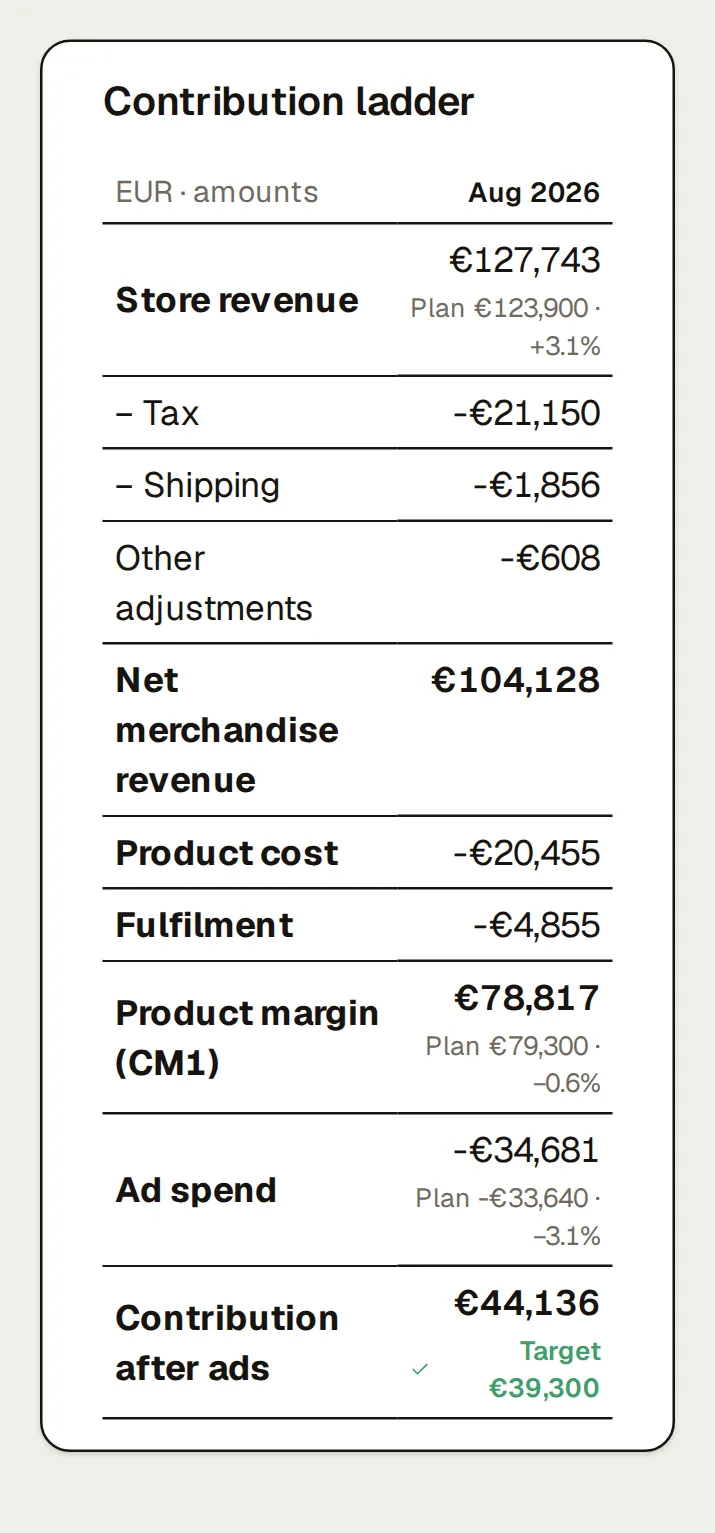
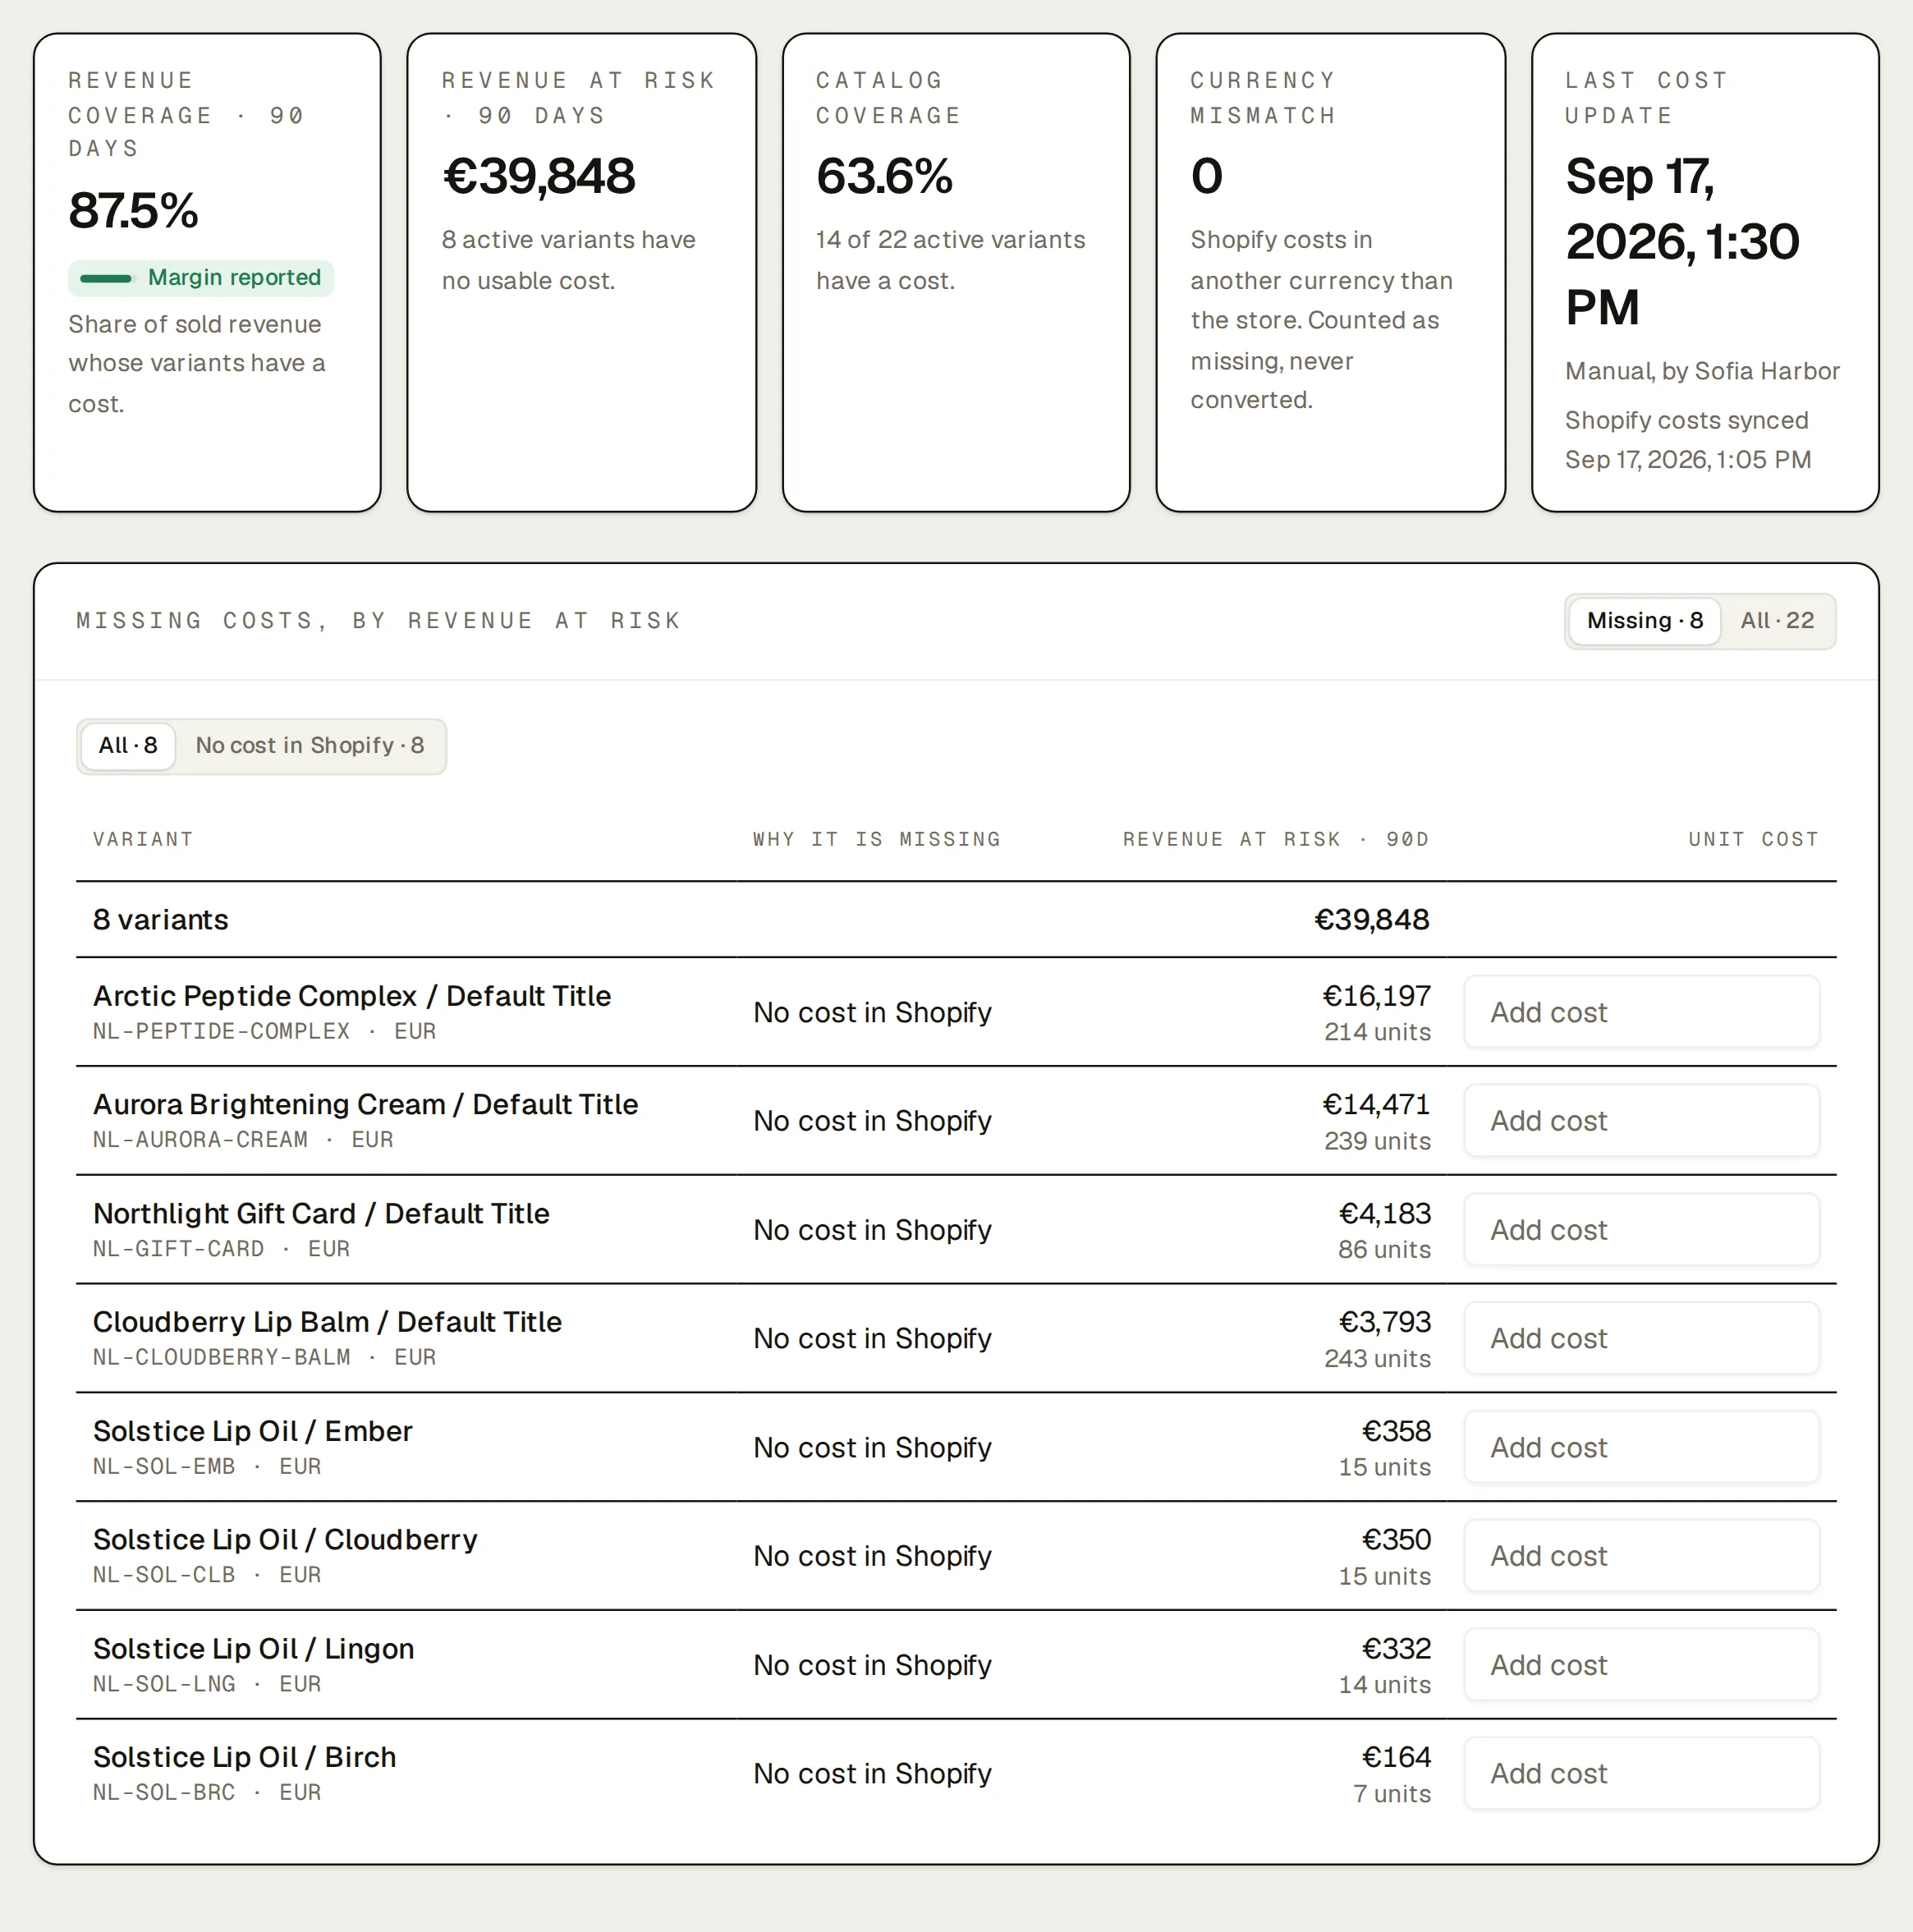
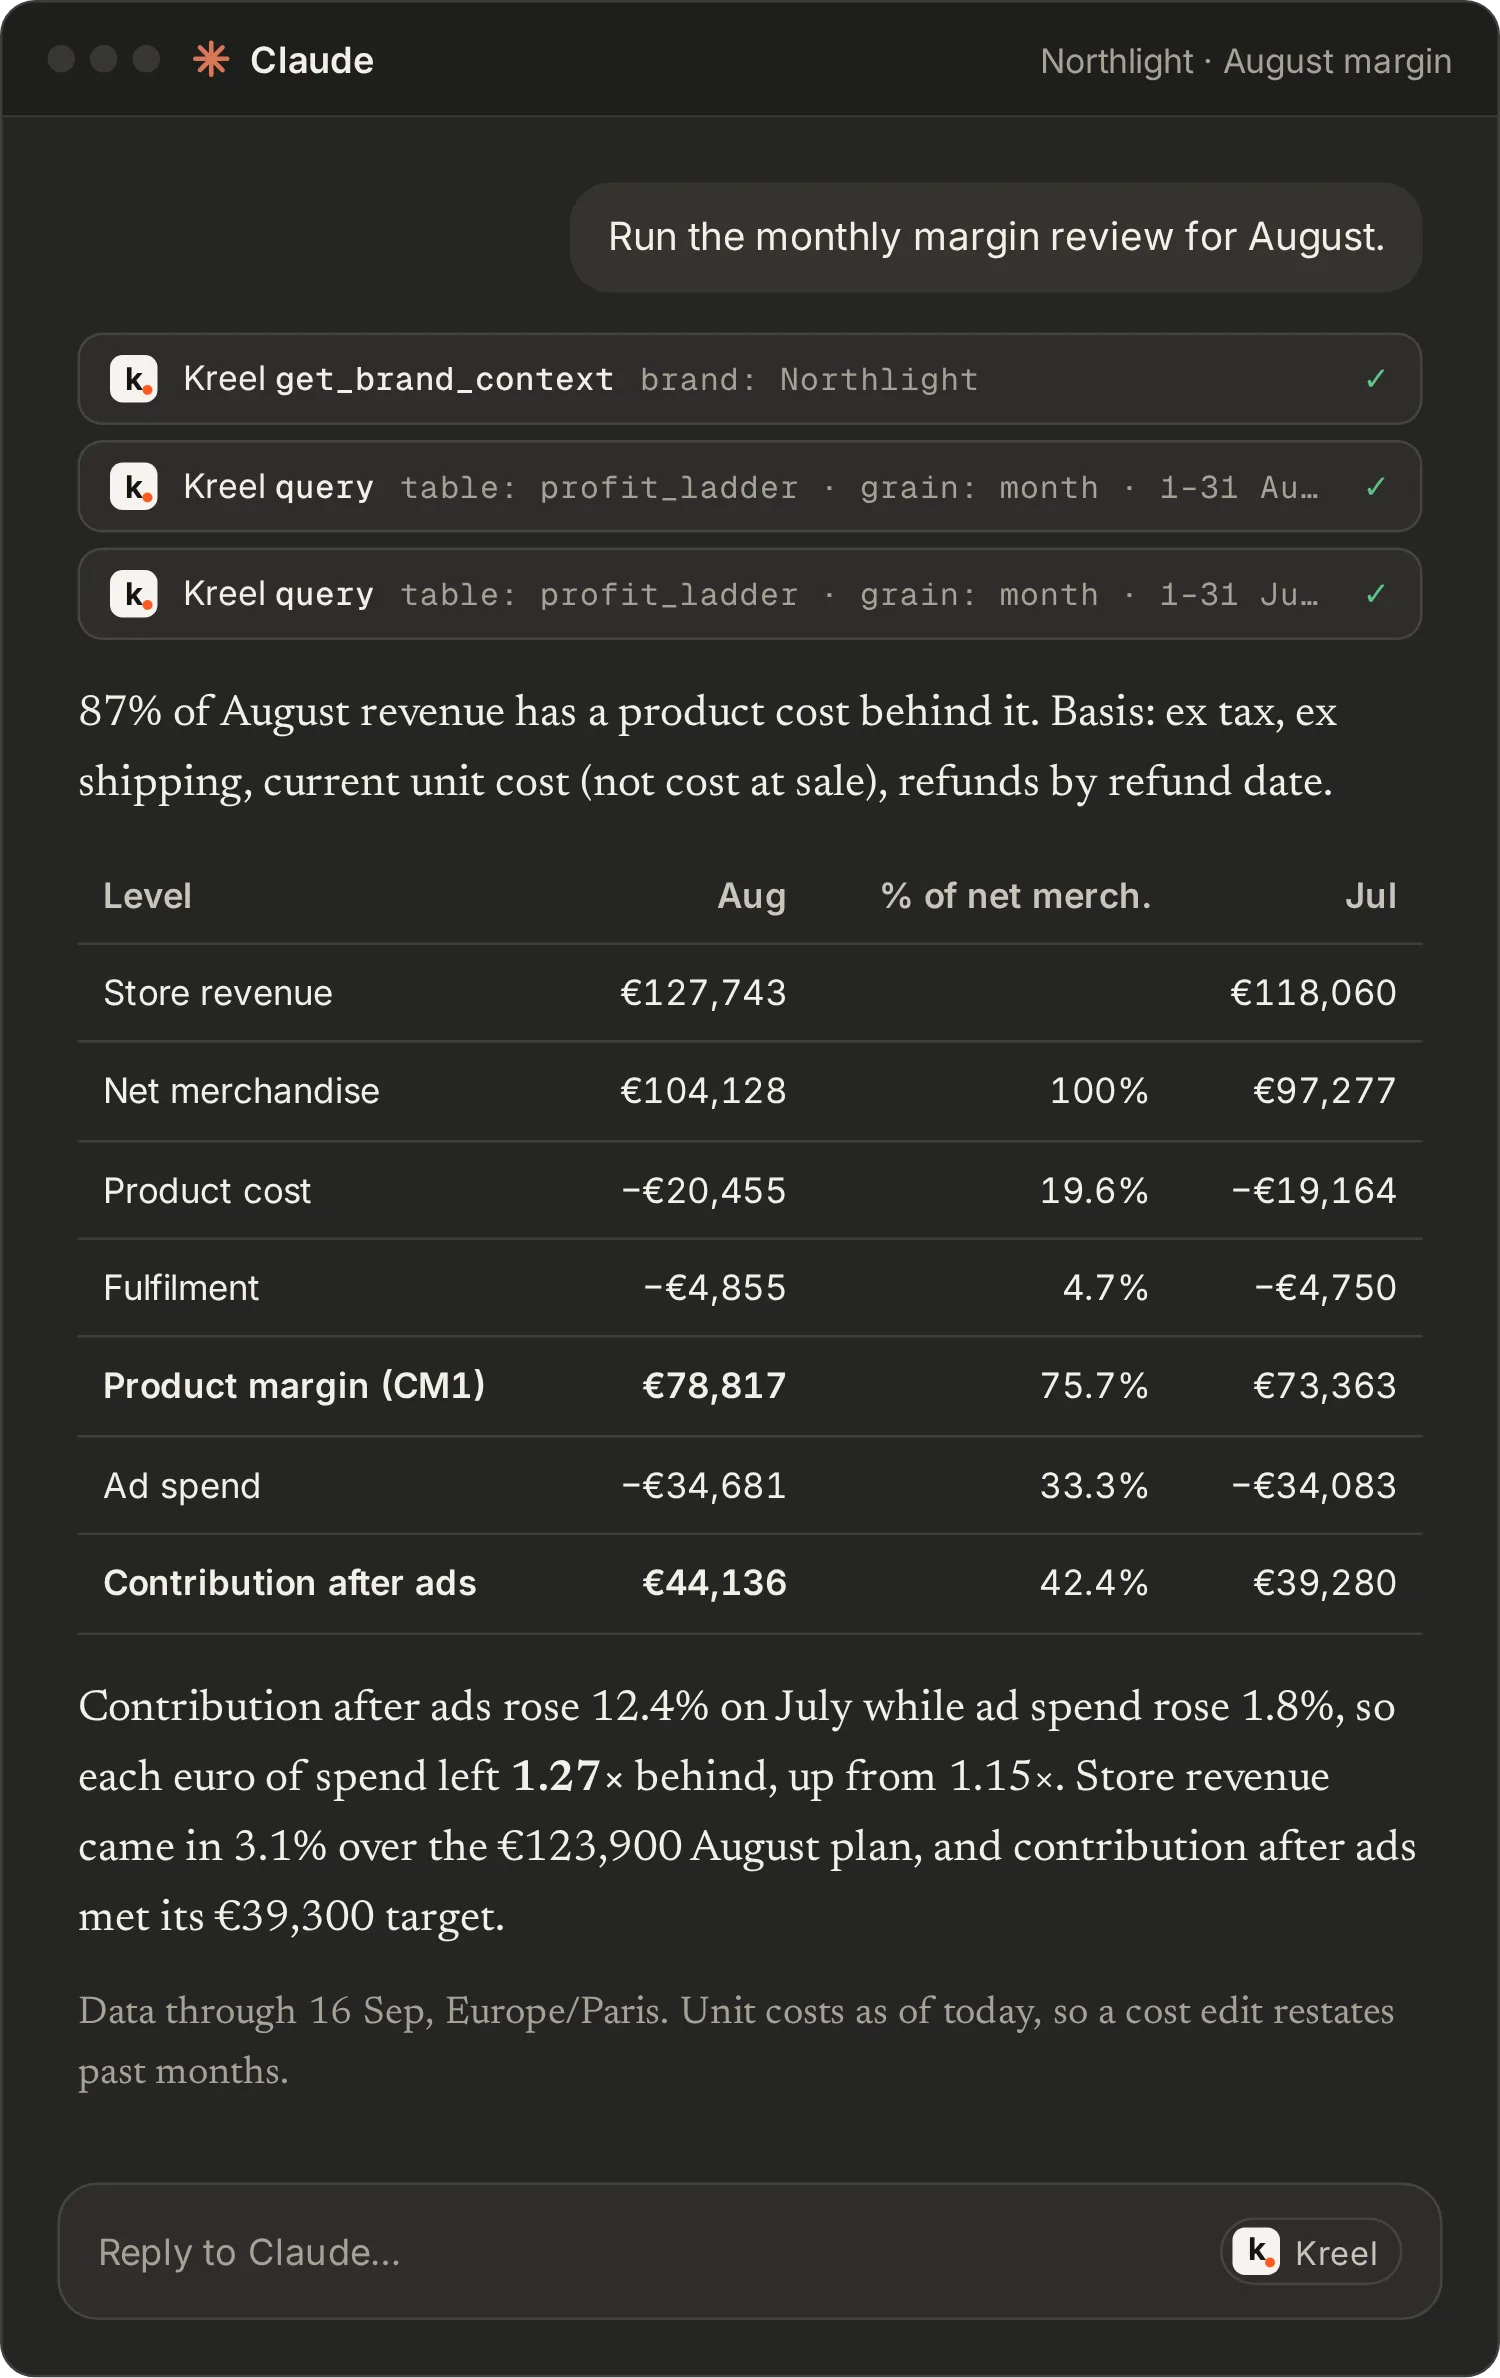
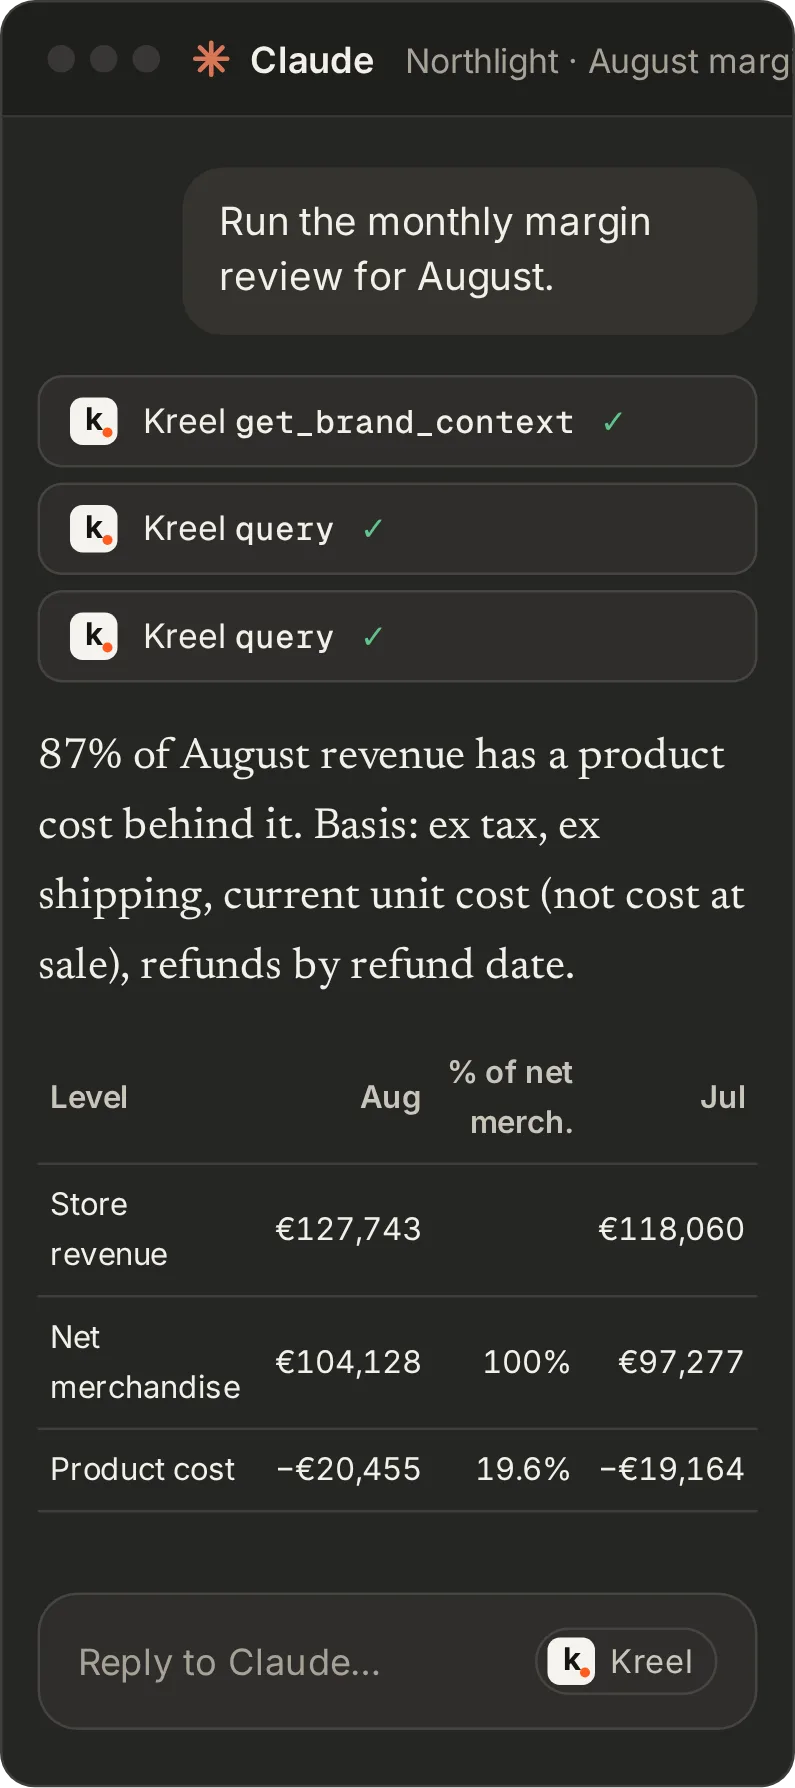
The Margin page walks from store revenue through tax, shipping, product cost and an optional flat fulfilment cost to product margin (CM1), then takes off ad spend from Meta, Google and TikTok to leave contribution after ads. Each month says how much of its revenue has a product cost behind it, and when that falls below 80% Kreel withholds the figure instead of guessing. A product table under the ladder ranks margin by product and lists the products still missing a cost.
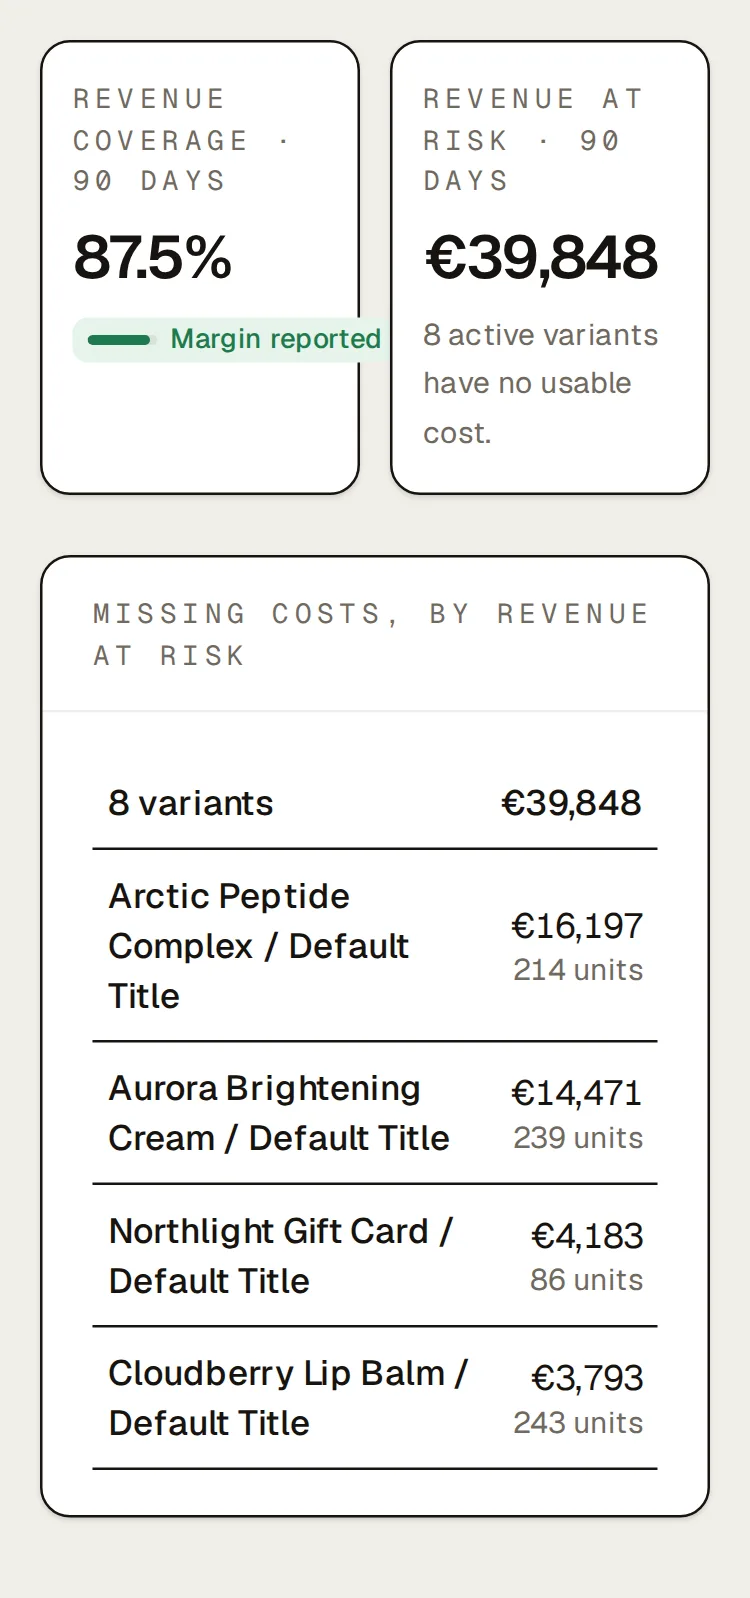
Costs come from the unit cost in Shopify, a CSV you import with a preview of every change, or your AI. The missing-costs list is sorted by the revenue each gap puts at risk, so you can fix the biggest gaps first.
The ladder stops at contribution after ads. It uses today’s unit costs, so editing a cost restates past months, and it excludes tax and shipping.
Are new customers paying back the ads?
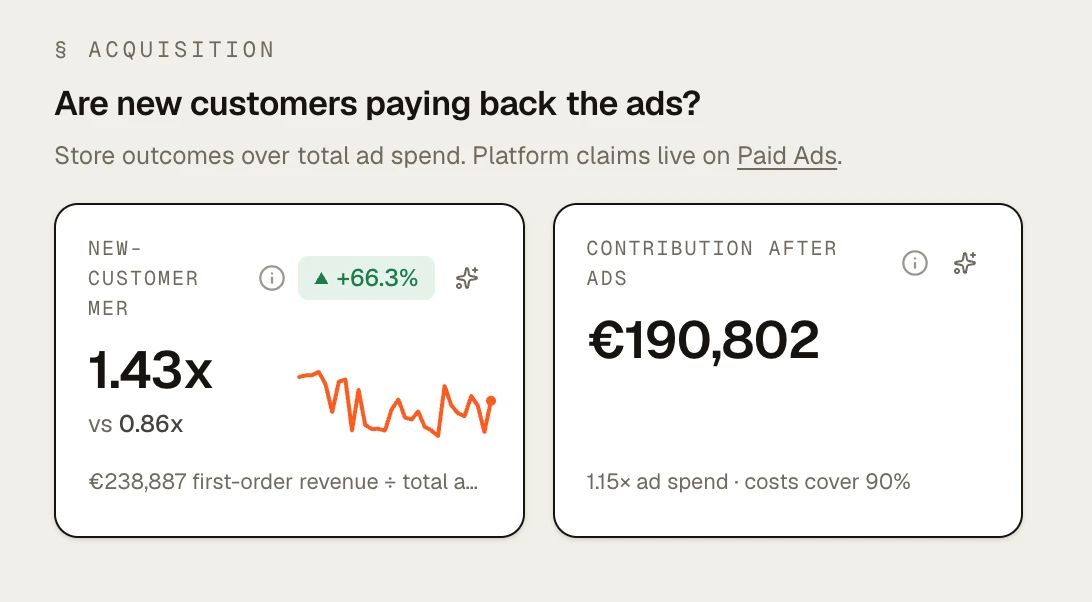
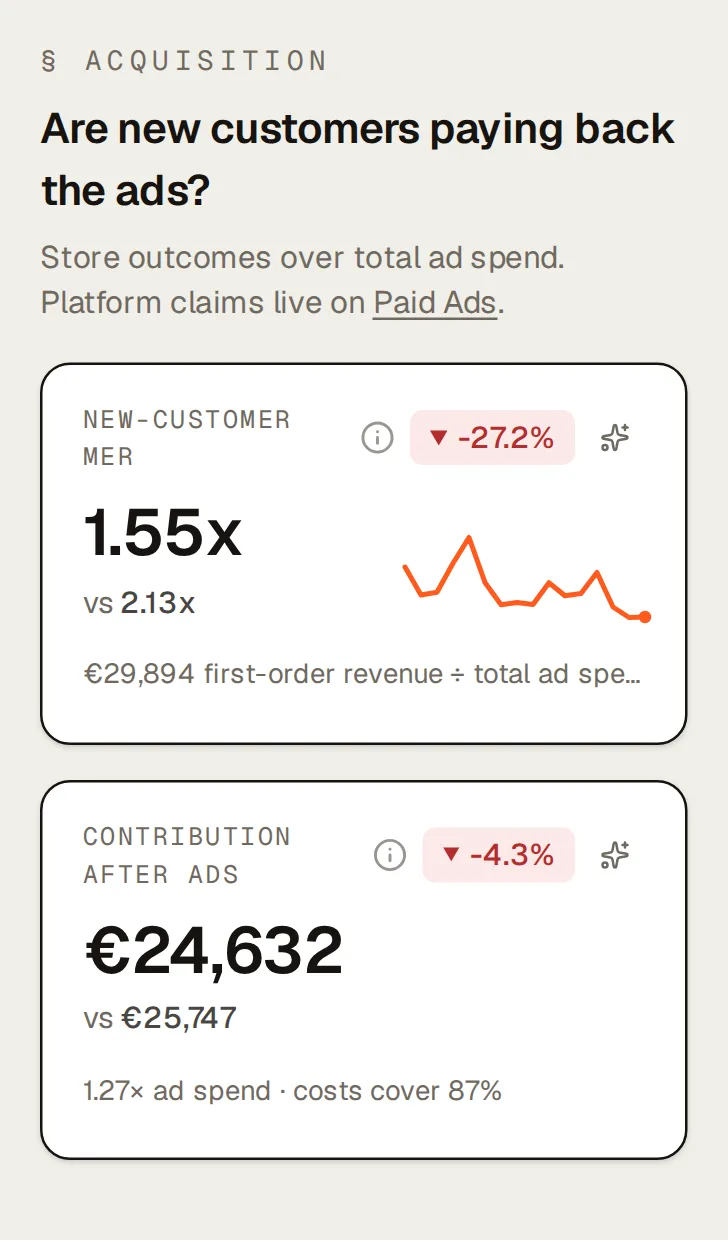
Under the chart, new-customer MER (first-order revenue over ad spend) and contribution after ads sit next to new-customer CAC. Together they show what a new customer cost and what the first order earned, for example a €65.94 new-customer CAC next to a new-customer MER of 1.55x on €29,894 of first-order revenue.
Did traffic change, or did conversion?
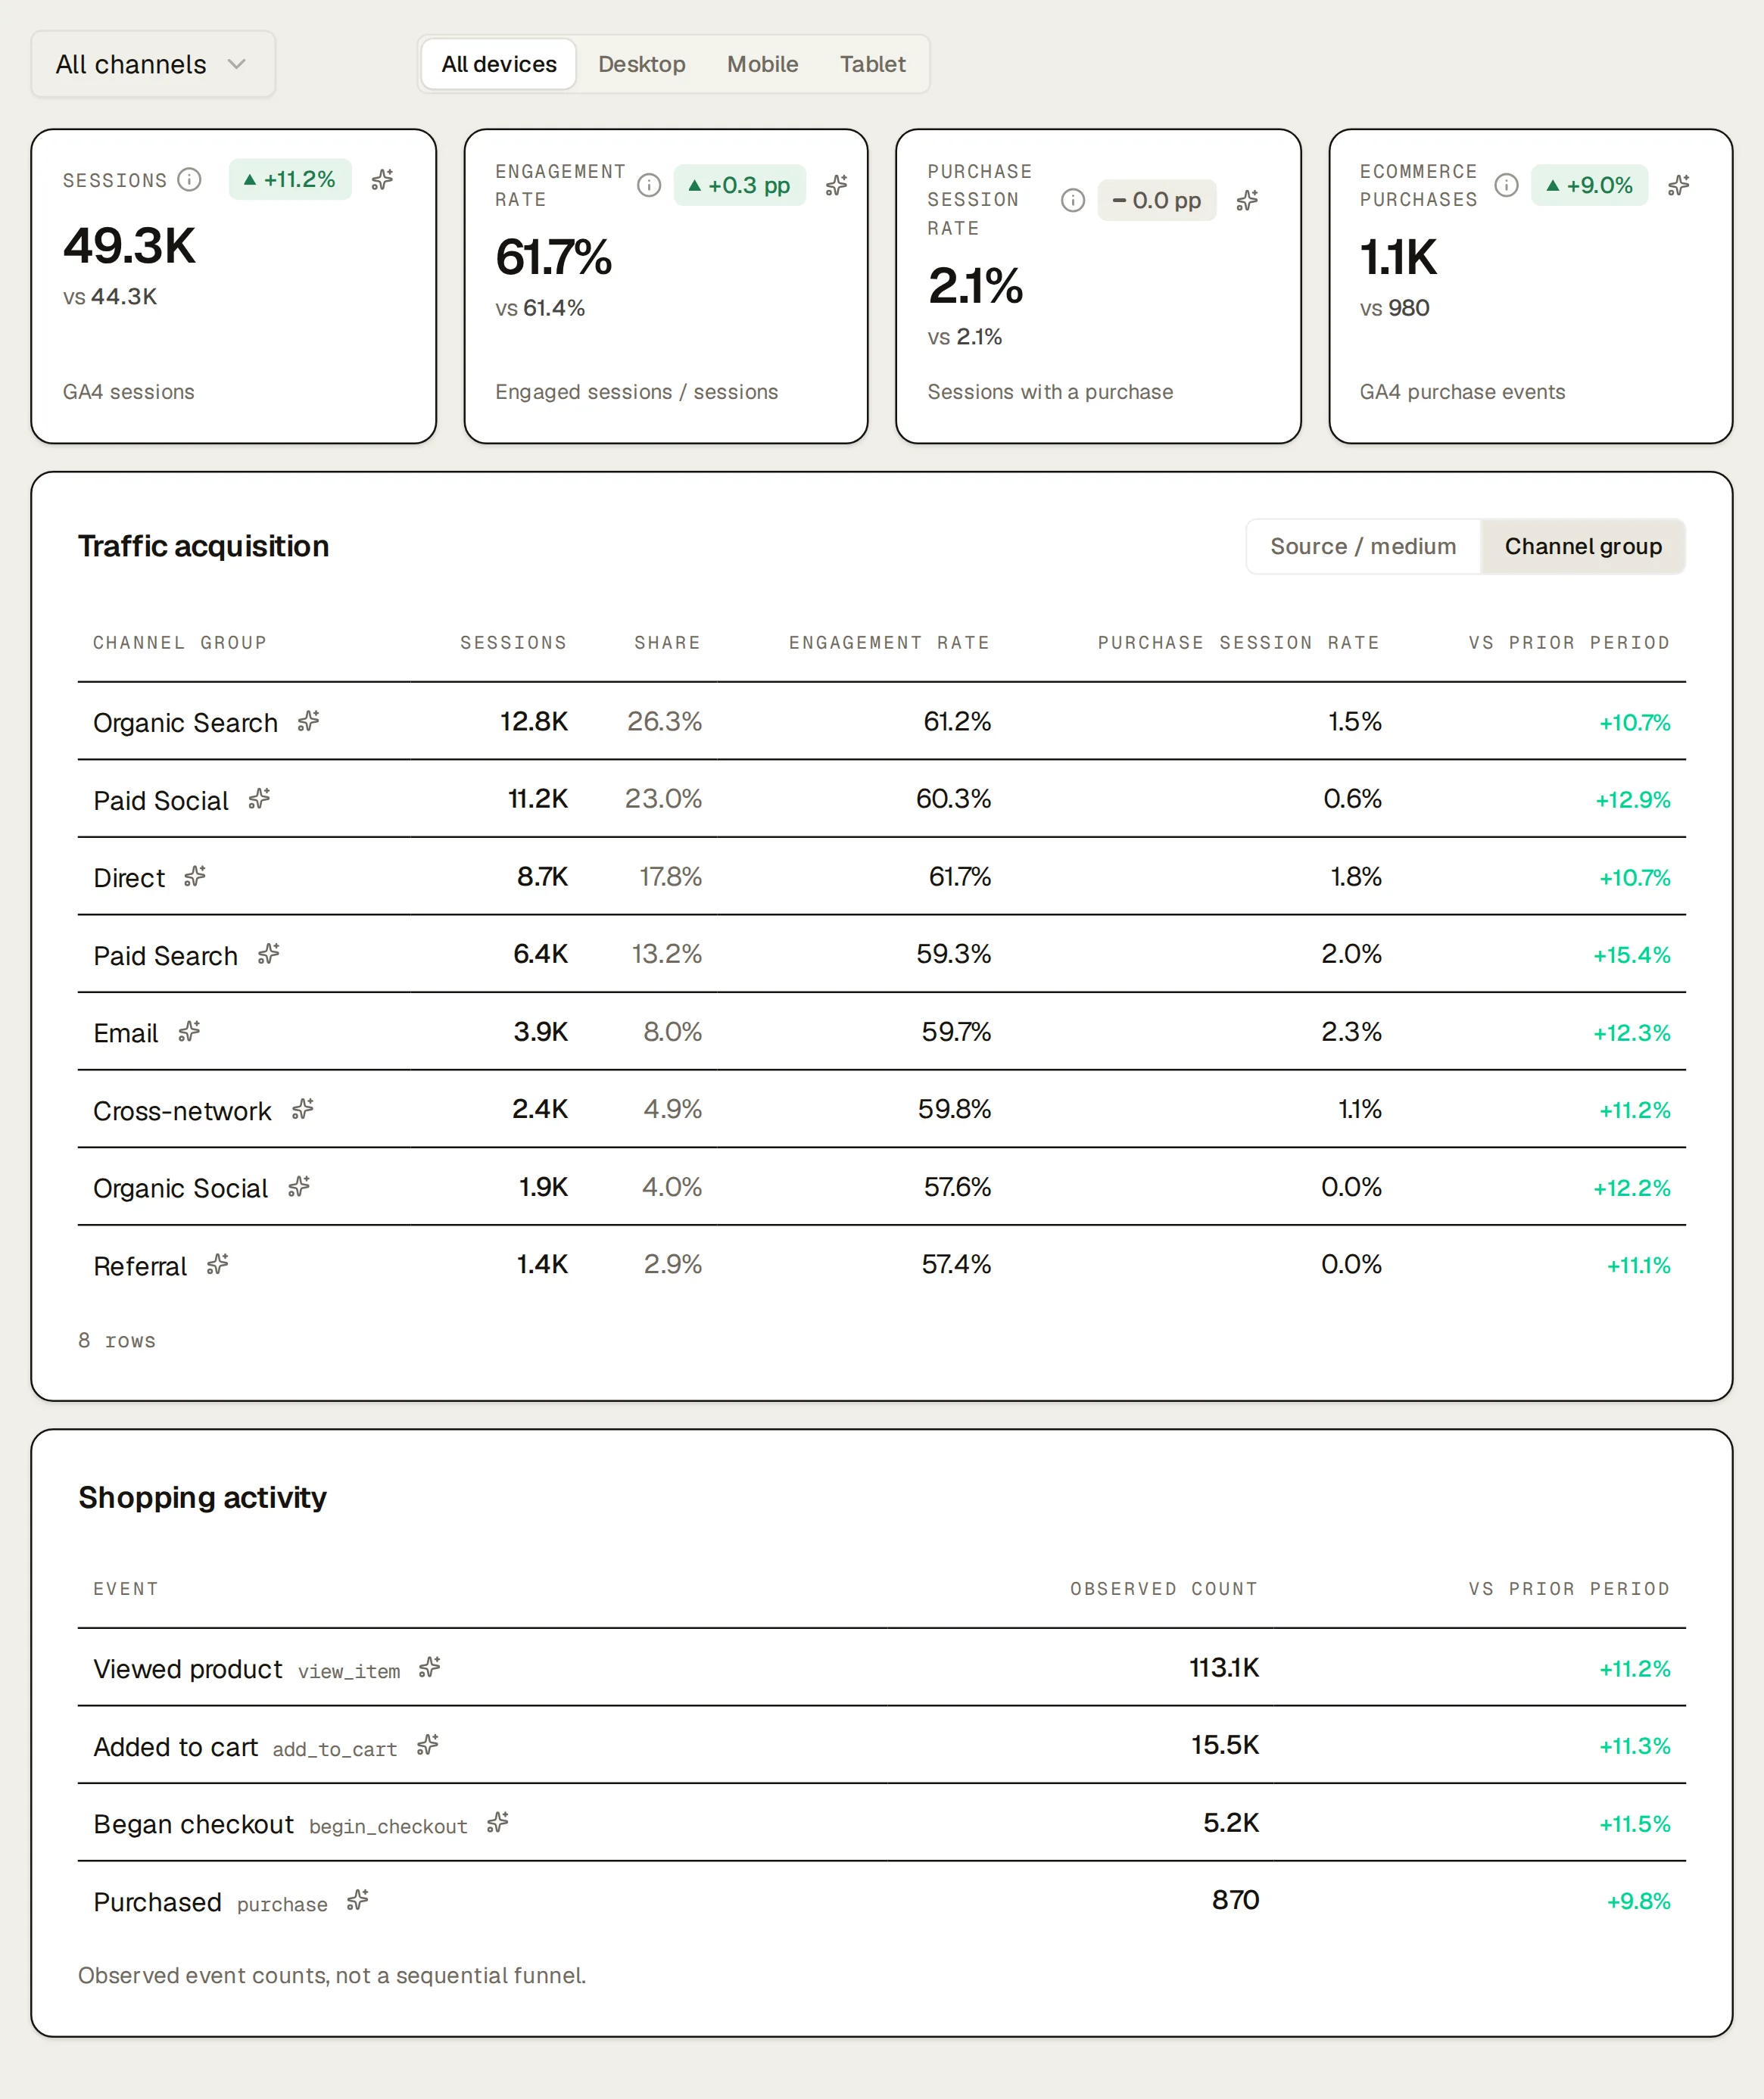
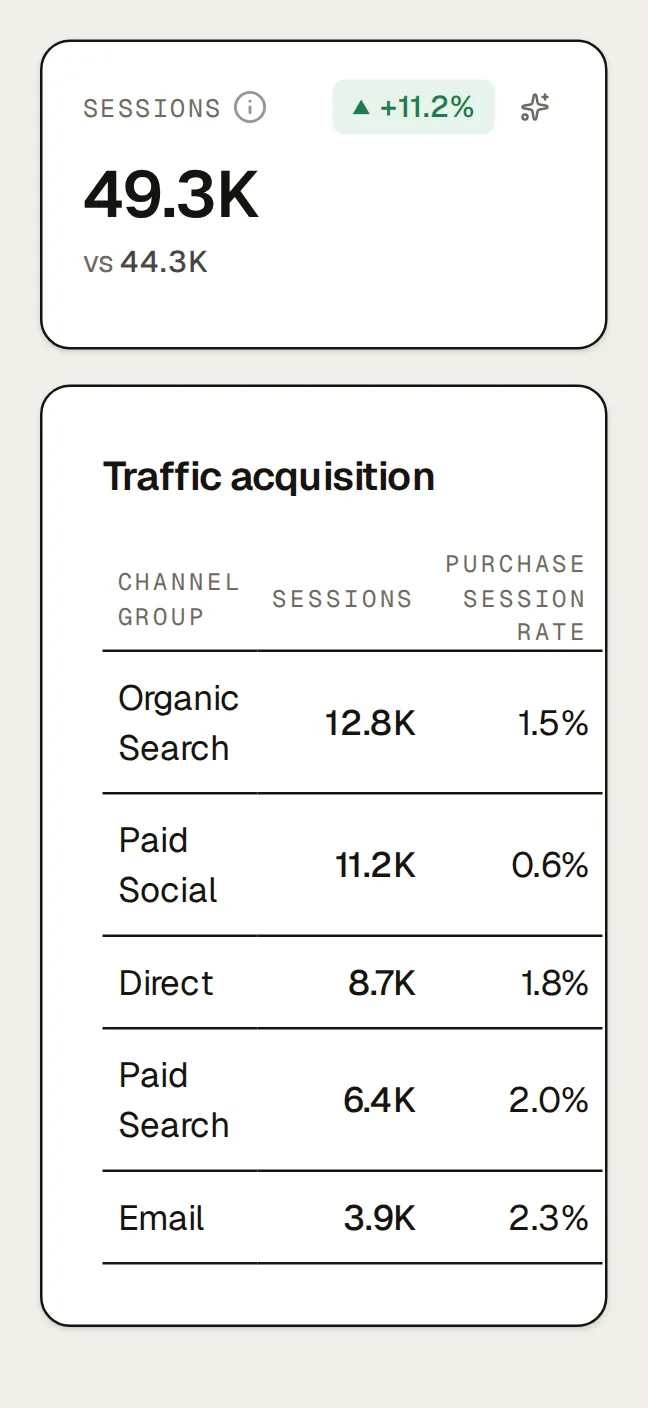
Connect Google Analytics 4 and the Website tab shows sessions, engagement rate, purchase session rate and the shopping events (viewed product, added to cart, began checkout, purchased) by channel group, source, landing page and device. When revenue moves, you can see whether traffic moved or conversion did. GA4 stays labelled as GA4 and is never added to store or ad revenue.
Also on this page
- Your revenue rules.
- Include or leave out tax and shipping, and drop POS or wholesale channels from every number.
- Several stores, one currency.
- Report a brand’s stores and ad accounts together, converted into one currency at each day’s rate, or narrow to one store or a saved group such as “EU”.
- Comparisons that say when they can’t compare.
- Pick previous period or last year; if the history doesn’t cover it, the tile says why instead of showing a number.
Ask it in your own AI
| Prompt | The question it answers |
|---|---|
| Weekly report | How did last week go against our monthly targets, and what changed? |
| Monthly margin review | What was September’s contribution after ads, and how much revenue had a cost behind it? |
| Monthly report | How did the month compare with the one before, channel by channel? |
| Daily pulse | Anything off yesterday in spend, delivery or pace? |
| Ask about this view | Why did this tile drop? (Press Ask on any tile.) |
Every prompt runs in your Claude or ChatGPT. Kreel never writes to your store or ad accounts.
What it needs
- Shopify for store revenue, orders, AOV, new customers and margin.
- Meta, Google Ads or TikTok (any one) for ad spend, MER, new-customer CAC and contribution after ads.
- Klaviyo (optional) for email share of revenue.
- Google Analytics 4 (optional) for the Website tab.
- Product costs covering at least 80% of revenue for margin. Shopify’s unit cost counts.
A tile whose source isn’t connected says “not connected” rather than showing zero.
Questions about Kreel, answered plainly
Why doesn't Kreel's revenue match Shopify's Total sales report?
They count different things. Kreel shows the current value of orders placed in the period, with refunds counted in the period they happen, under the revenue rules you choose (with or without tax, shipping or POS sales). Shopify’s Total sales report adds up sales and returns as events on the day they happen. Both are right for what they measure, and Kreel’s definitions are published in the docs.
Does the margin include shipping costs, payment fees or overheads?
No. The ladder stops at contribution after ads: revenue less product cost, an optional flat fulfilment cost and ad spend, excluding tax and shipping, at today’s unit costs. Payment fees and shipping costs aren’t subtracted, and it isn’t a full P&L.
Does pace allow for seasonality?
No. Pace is a straight line from the first of the month to yesterday. For uneven months, put the month’s numbers in a budget plan.
What does MER mean in Kreel?
Store revenue divided by total ad spend across Meta, Google and TikTok. It’s a store number, not a platform’s ROAS. Each platform’s own ROAS is on Paid ads.
Can I use it with Shopify only?
Yes. The store tiles, products, margin (CM1) and cohorts work with Shopify alone; ad tiles show “not connected” until you add a platform.
Grow your ecommerce brand from one place.
14 days free. A card is needed to start, and nothing is charged until the trial ends.