When does a new customer pay back?

Cohorts follow each month’s new customers for up to 24 months, with retention, lifetime value and contribution per customer. Next to them: CAC payback by acquisition channel, and the customers who should have ordered again by now.

14 days free. A card is needed to start, and nothing is charged until the trial ends.
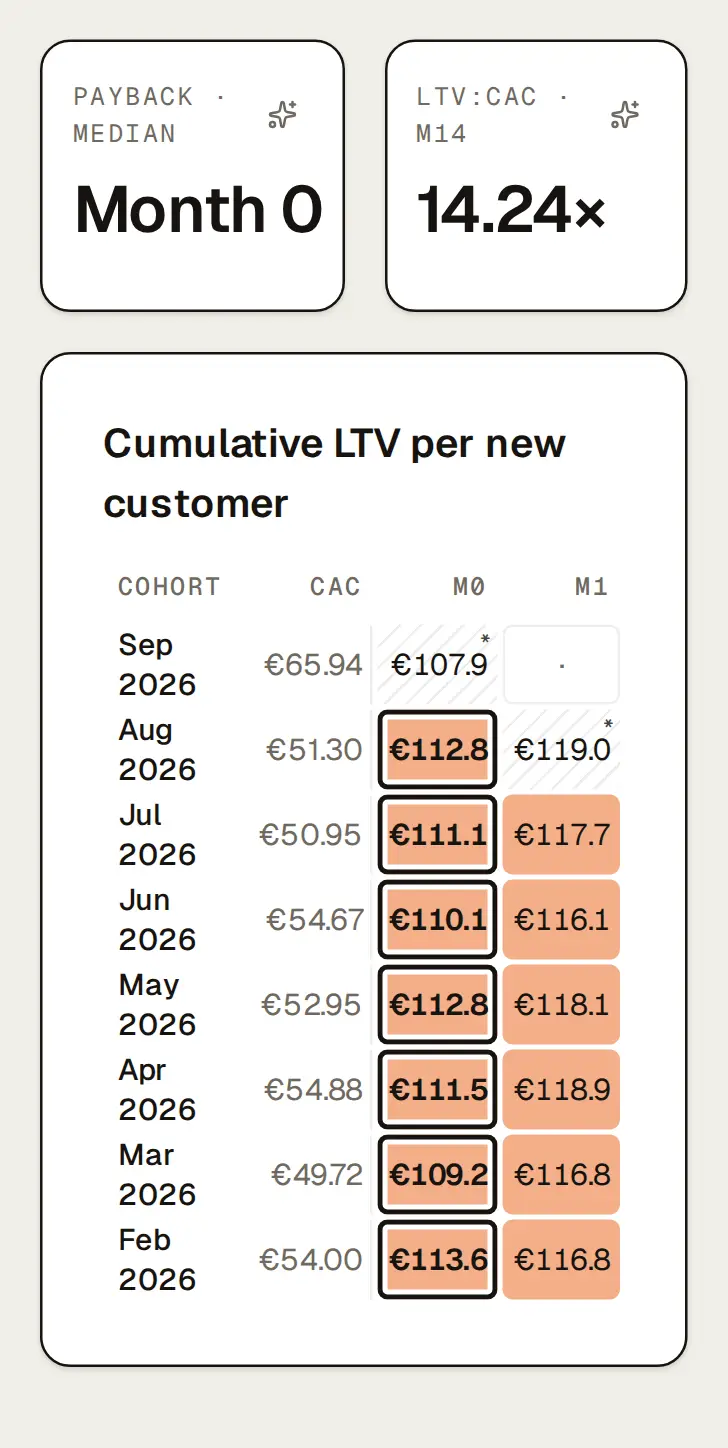
Northlight’s cohorts, all customers by first-order month: 16.0K cohort customers, new-customer CAC €50.08, median payback on the first order (month 0, revenue basis · 15 of 15 paid back), LTV:CAC 14.24× (month 14), above the cumulative LTV per new customer heatmap, one row per monthly cohort with ad spend from Sep 2026 back to Jun 2025 and their weighted average, with each cohort’s new customers and CAC and its revenue per customer month by month since the first order, the month it covered its CAC outlined. Northlight’s cohorts, all customers by first-order month: 16.0K cohort customers, new-customer CAC €50.08, median payback on the first order (month 0, revenue basis · 15 of 15 paid back), LTV:CAC 14.24× (month 14), above the cumulative LTV per new customer heatmap, one row per monthly cohort with ad spend from Sep 2026 back to Jun 2025 and their weighted average, with each cohort’s new customers and CAC and its revenue per customer month by month since the first order, the month it covered its CAC outlined.
Cohorts, with the month each one paid back its CAC outlined. Demo data: Northlight, a fictional brand.

Cohorts by first product, discount code, country or channel

Slice cohorts by what the first order looked like: first product, discount code, country, acquisition channel, sales channel, product type, AOV band, discount depth, item count, marketing consent, order tags or UTM campaign. Switch between retention, cumulative LTV and cumulative contribution per customer, read it as a heatmap or as curves, and outline the month each cohort covered its CAC. A side panel lists the first products, codes, countries or channels whose customers come back most often within 90 days.

Refunds land in the month they happen, so a cumulative cell can dip. Customers whose earlier history isn’t in the store’s data are left out, and the page says how many.
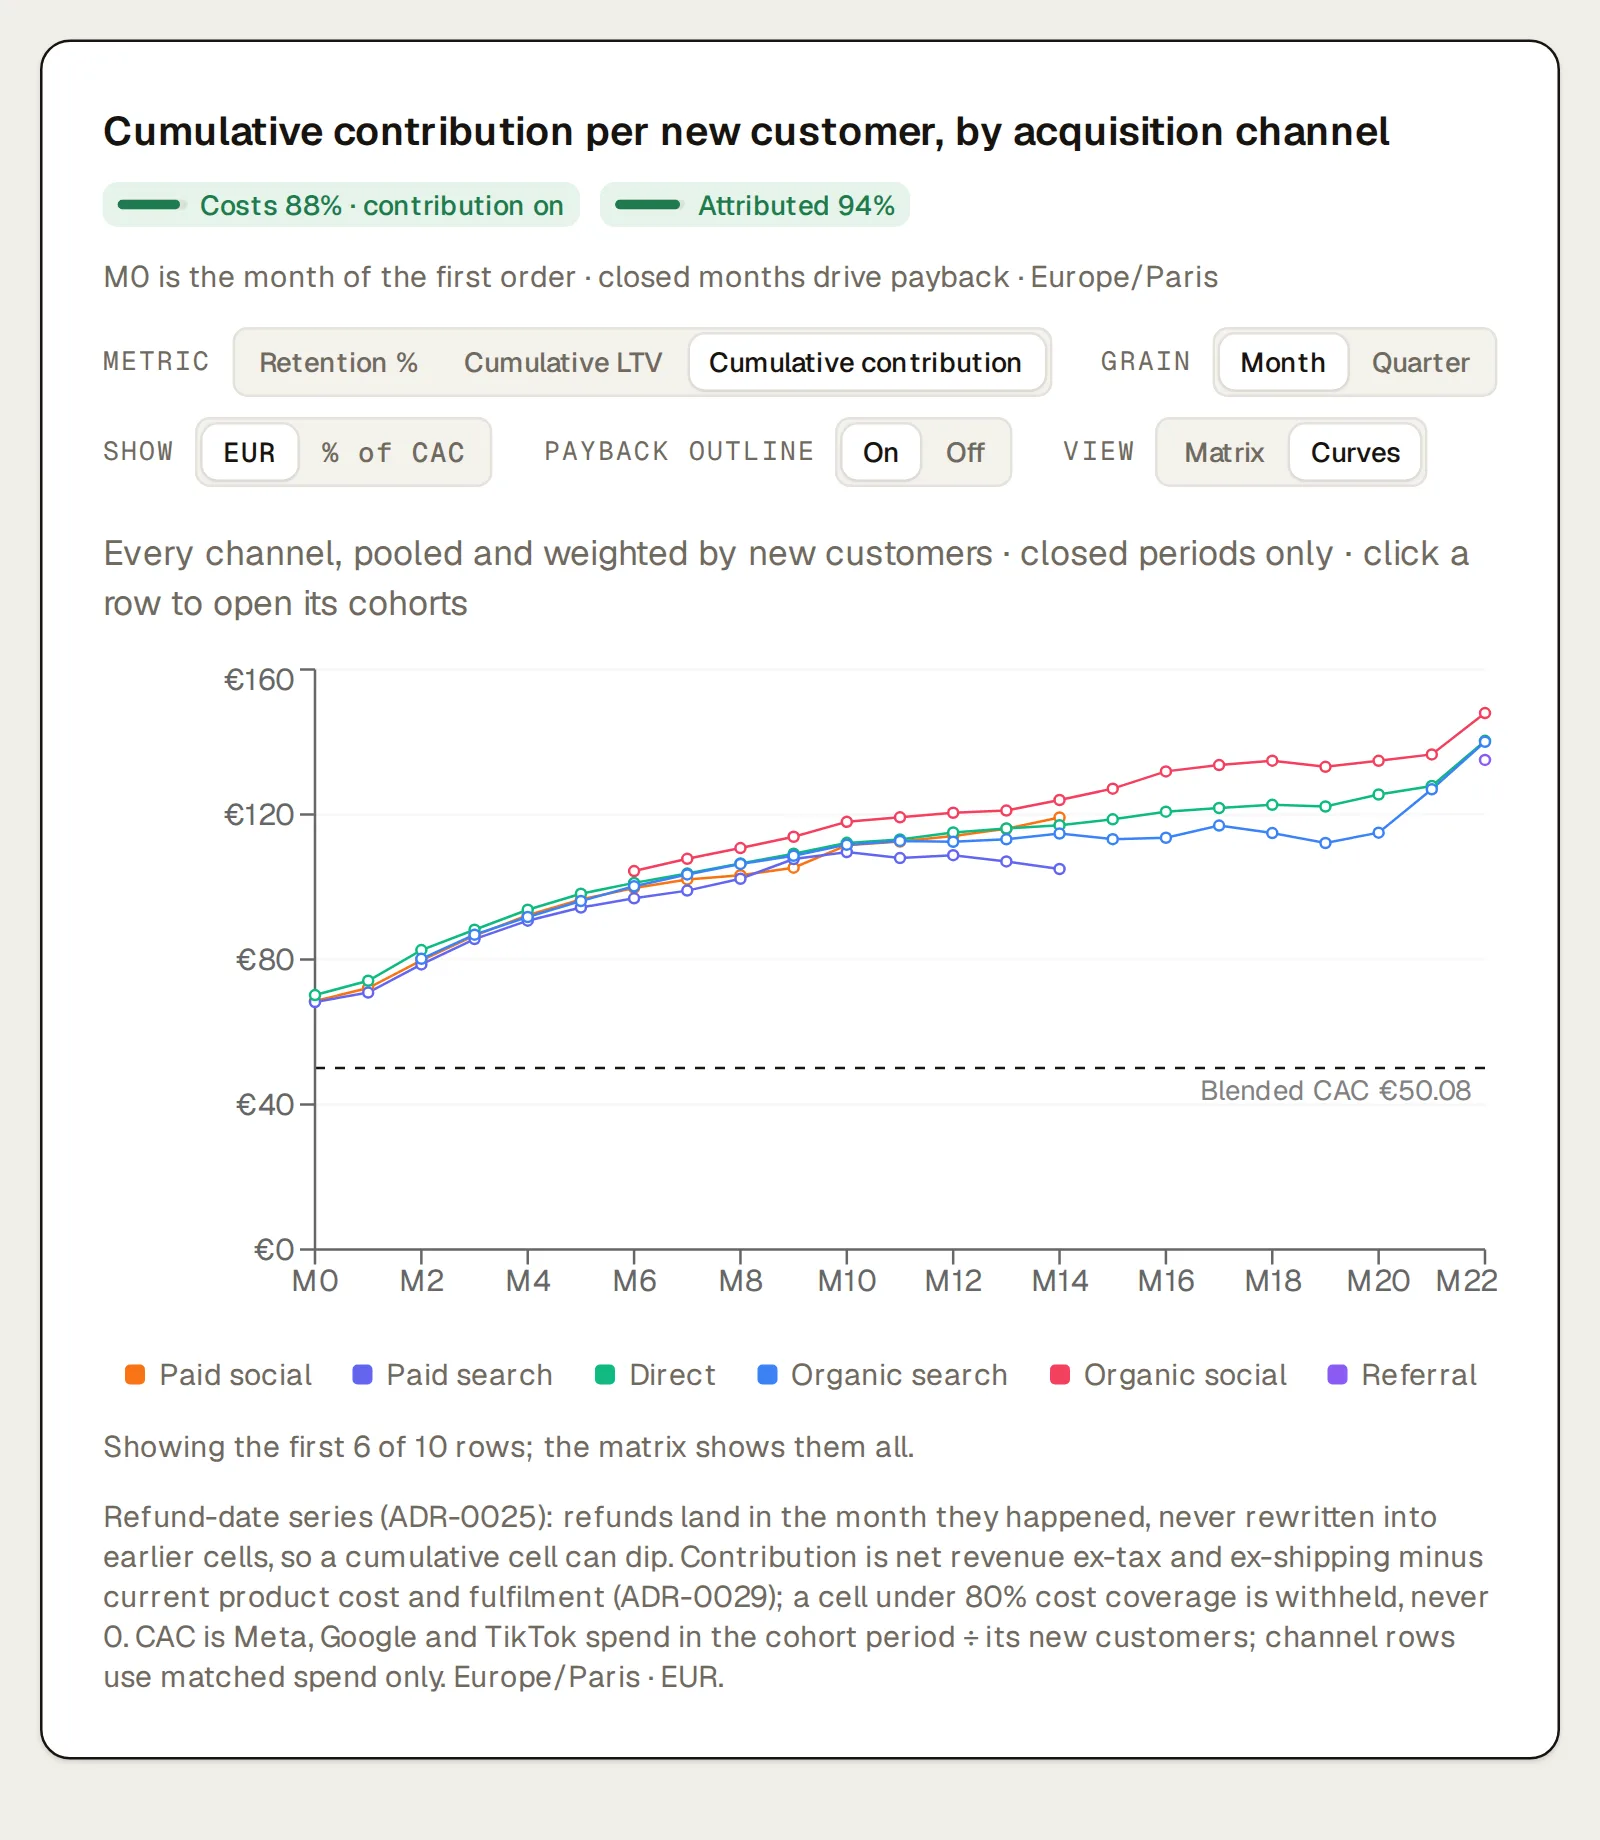
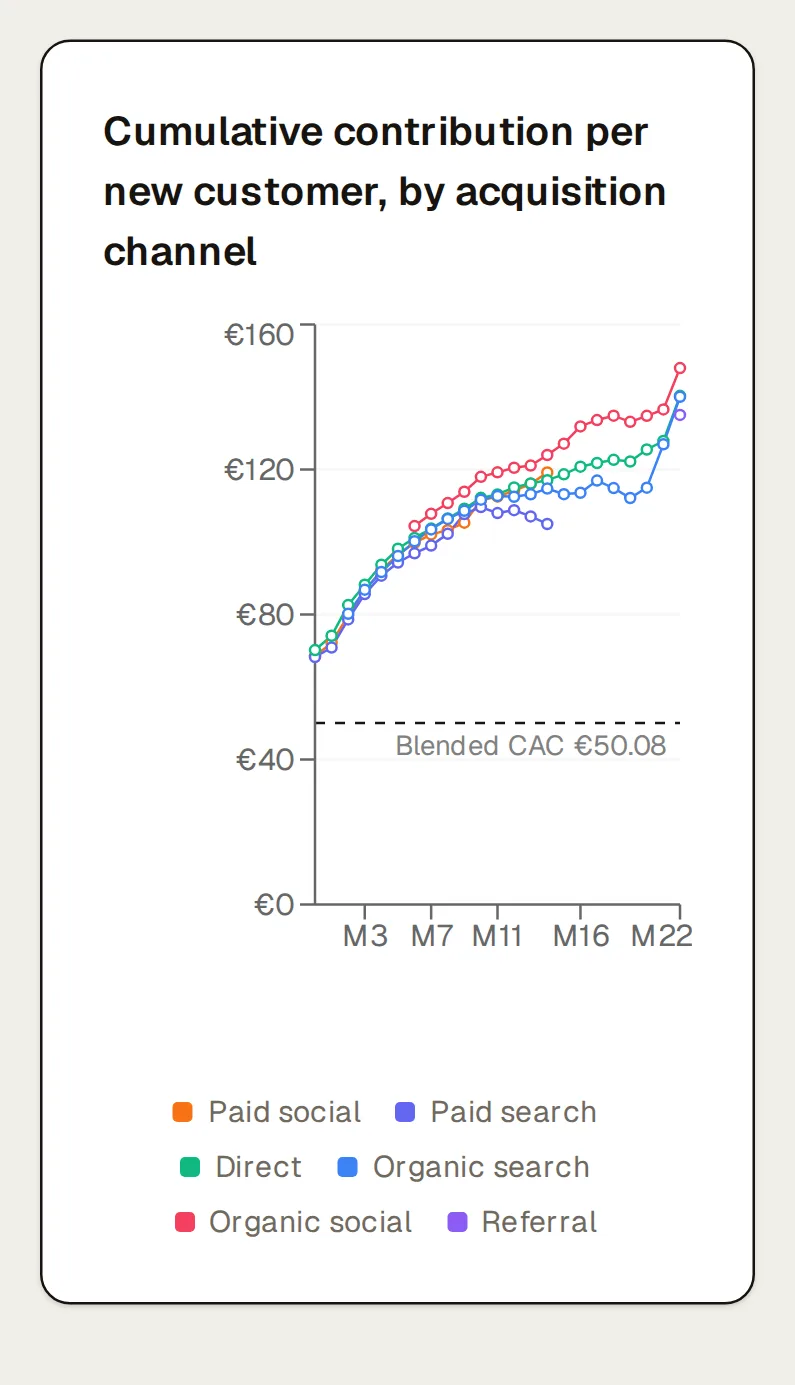
Northlight’s cohorts by acquisition channel as curves: cumulative contribution per new customer month by month since the first order, one line per channel (Paid social, Paid search, Direct, Organic search, Organic social, Referral), against a dashed line at the blended CAC. Showing the first 6 of 10 rows; the matrix shows them all. Northlight’s cohorts by acquisition channel as curves: cumulative contribution per new customer month by month since the first order, one line per channel (Paid social, Paid search, Direct, Organic search, Organic social, Referral), against a dashed line at the blended CAC. Showing the first 6 of 10 rows; the matrix shows them all.
Cohorts by acquisition channel, as curves against the blended CAC. Demo data: Northlight, a fictional brand.

Payback by acquisition channel

New customers, blended new-customer CAC, median payback month and LTV:CAC sit above a table that splits them by channel: paid social (Meta and TikTok spend) and paid search (Google spend). For example, both can pay back their CAC on the first order when read on revenue, and in month 3 when read on contribution. Payback can be read on revenue or, with product costs loaded, on contribution.

The channel comes from Shopify’s own record of each customer’s first visit, not from a Kreel pixel. A channel row only shows for months where at least 80% of new customers have one.
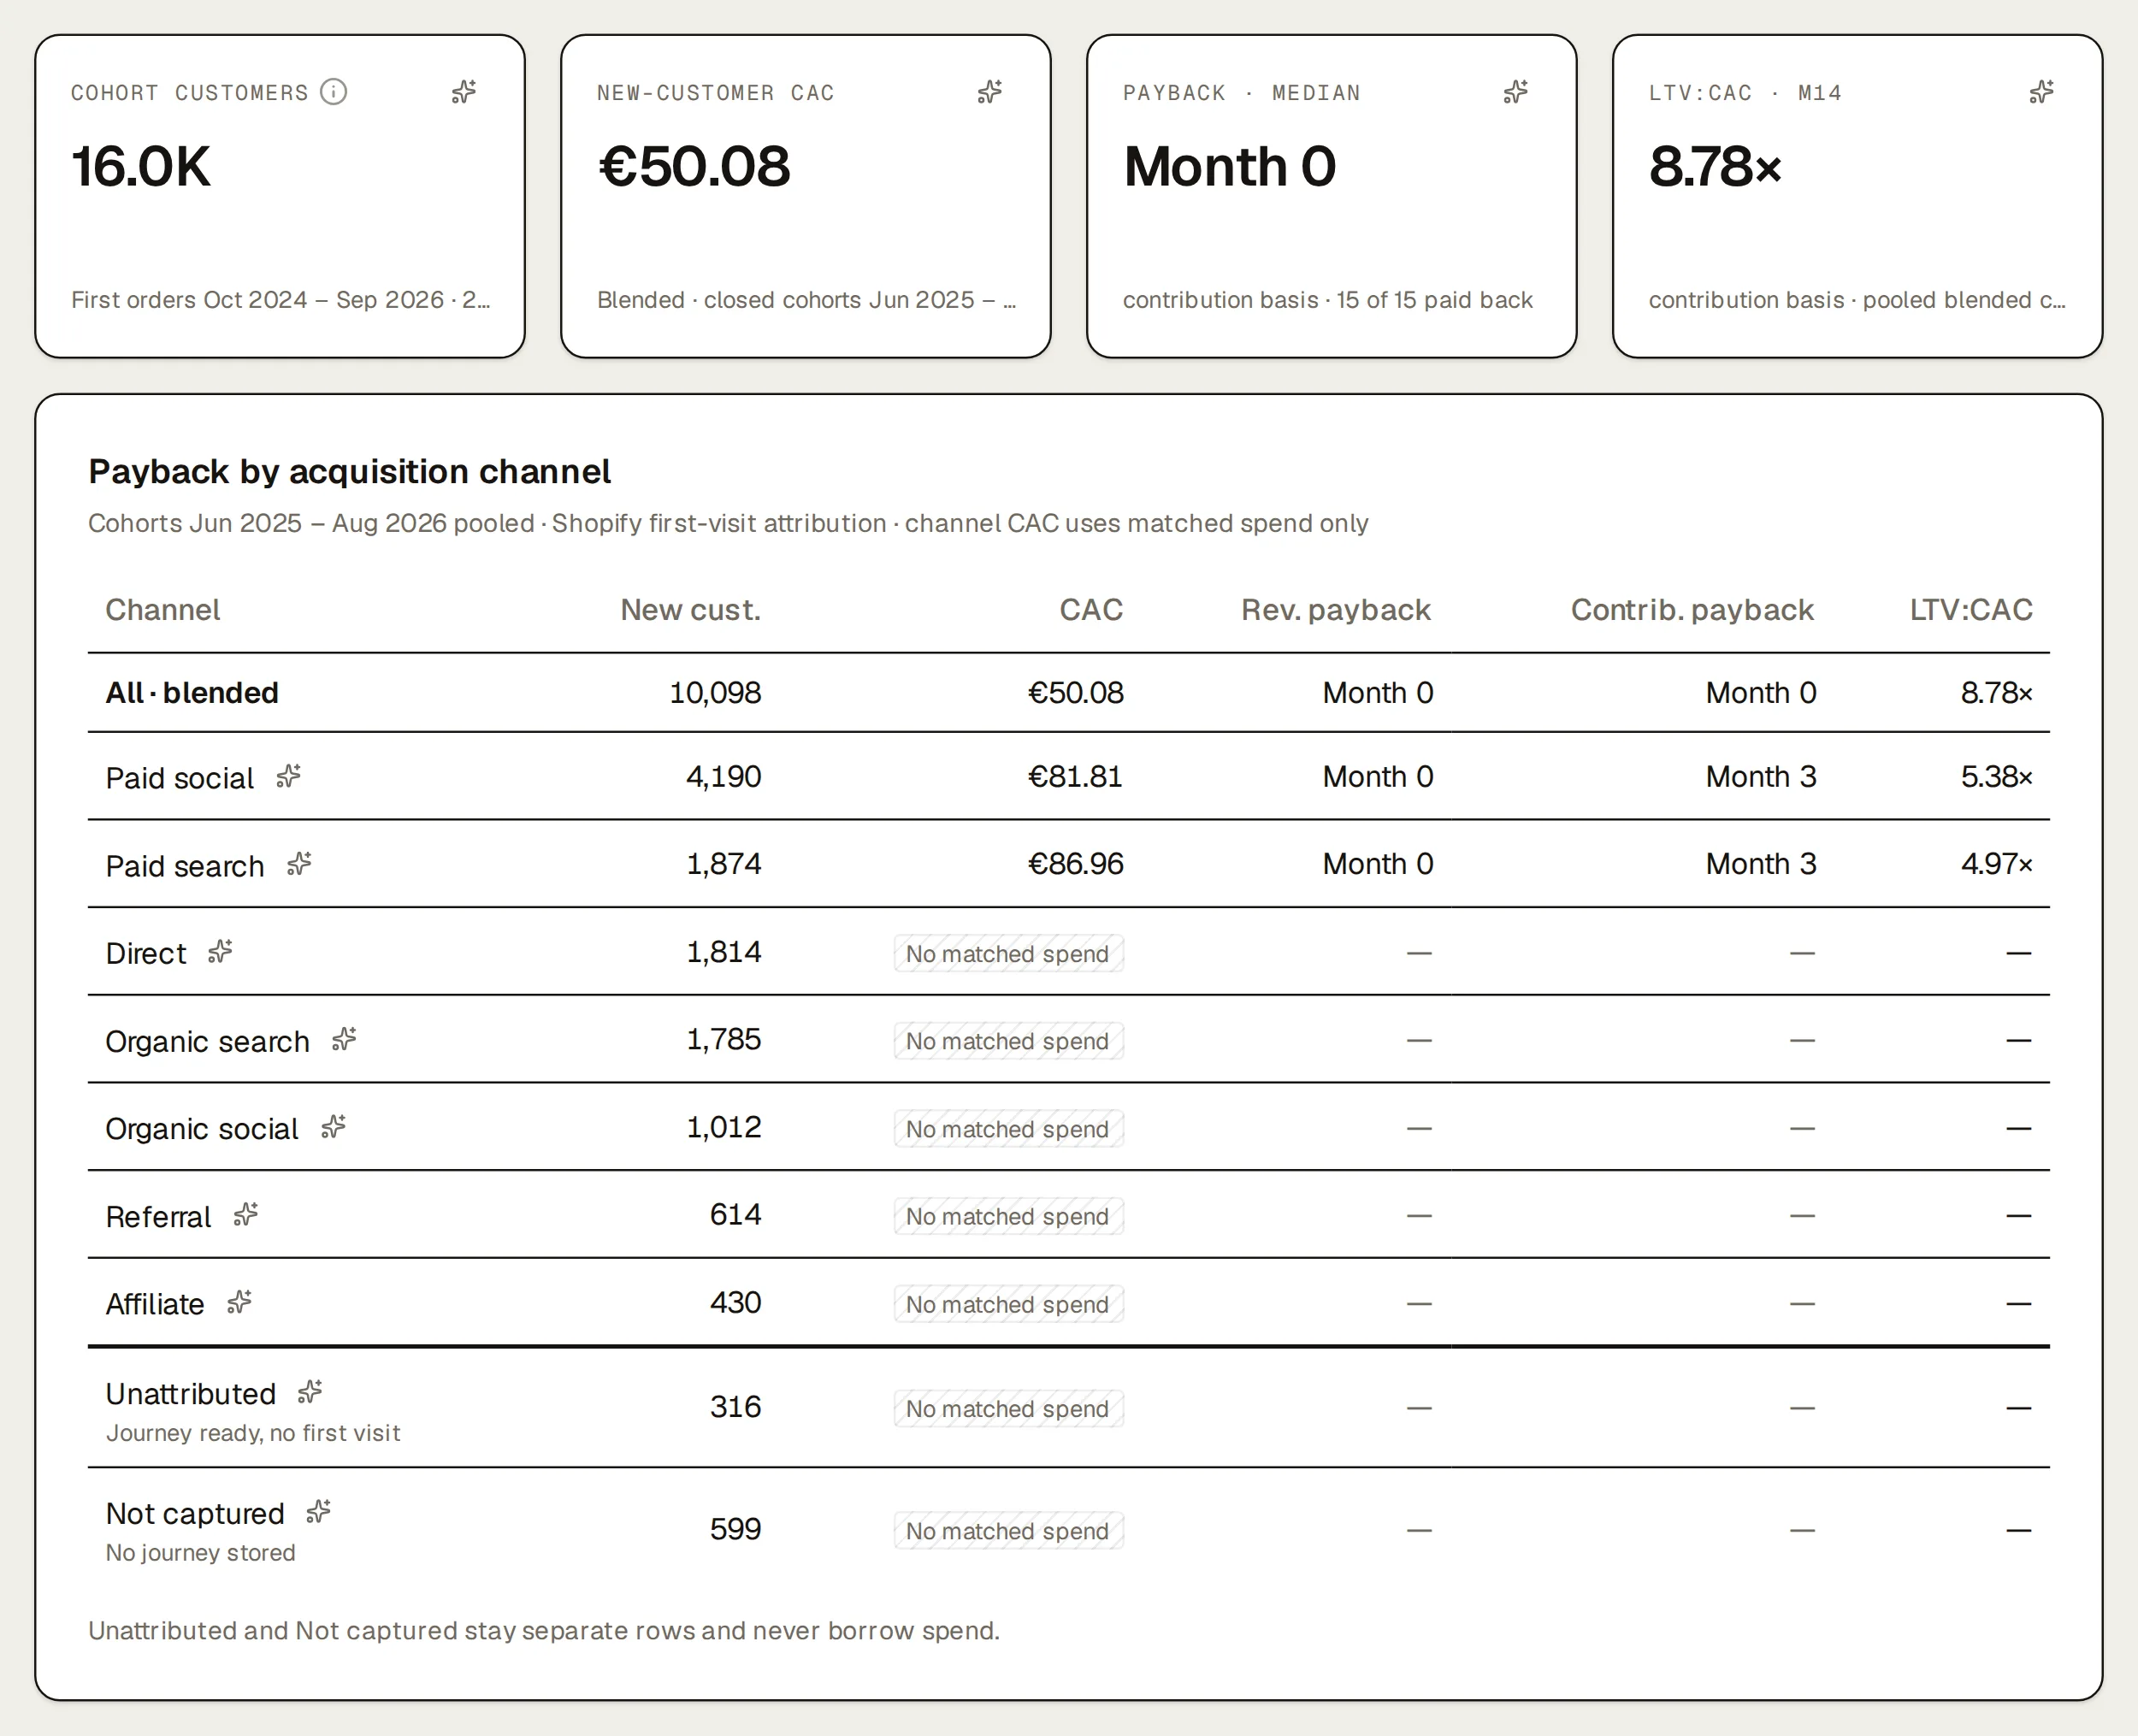
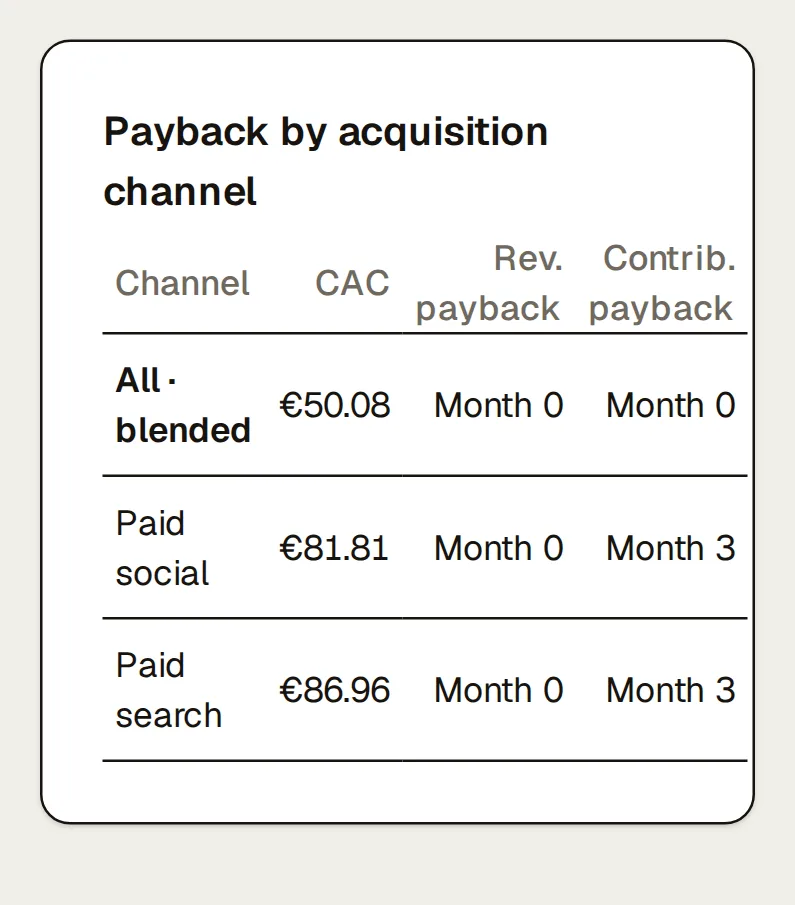
Northlight’s cohort KPIs above the payback by acquisition channel table: blended, 10,098 new customers at a CAC of €50.08, paying back in month 0 on revenue and month 0 on contribution, LTV:CAC 8.78×; paid social €81.81 CAC, month 3 on contribution; paid search €86.96 CAC, month 3 on contribution; the channels without matched spend listed below, and the unattributed and not-captured rows kept apart. Northlight’s cohort KPIs above the payback by acquisition channel table: blended, 10,098 new customers at a CAC of €50.08, paying back in month 0 on revenue and month 0 on contribution, LTV:CAC 8.78×; paid social €81.81 CAC, month 3 on contribution; paid search €86.96 CAC, month 3 on contribution; the channels without matched spend listed below, and the unattributed and not-captured rows kept apart.
Payback by acquisition channel. Demo data: Northlight, a fictional brand.

Customers who should have reordered by now

Kreel compares each customer with how long customers like them usually take to order again (judged by their first product, falling back to the whole store) and marks them overdue or lapsed. The card totals the value at stake over the last year (“696 customers overdue · €129,137 trailing annual value”), broken down by first product and channel, with the rule printed on the card. It’s an estimate from past behaviour, not a forecast, and the card says so.
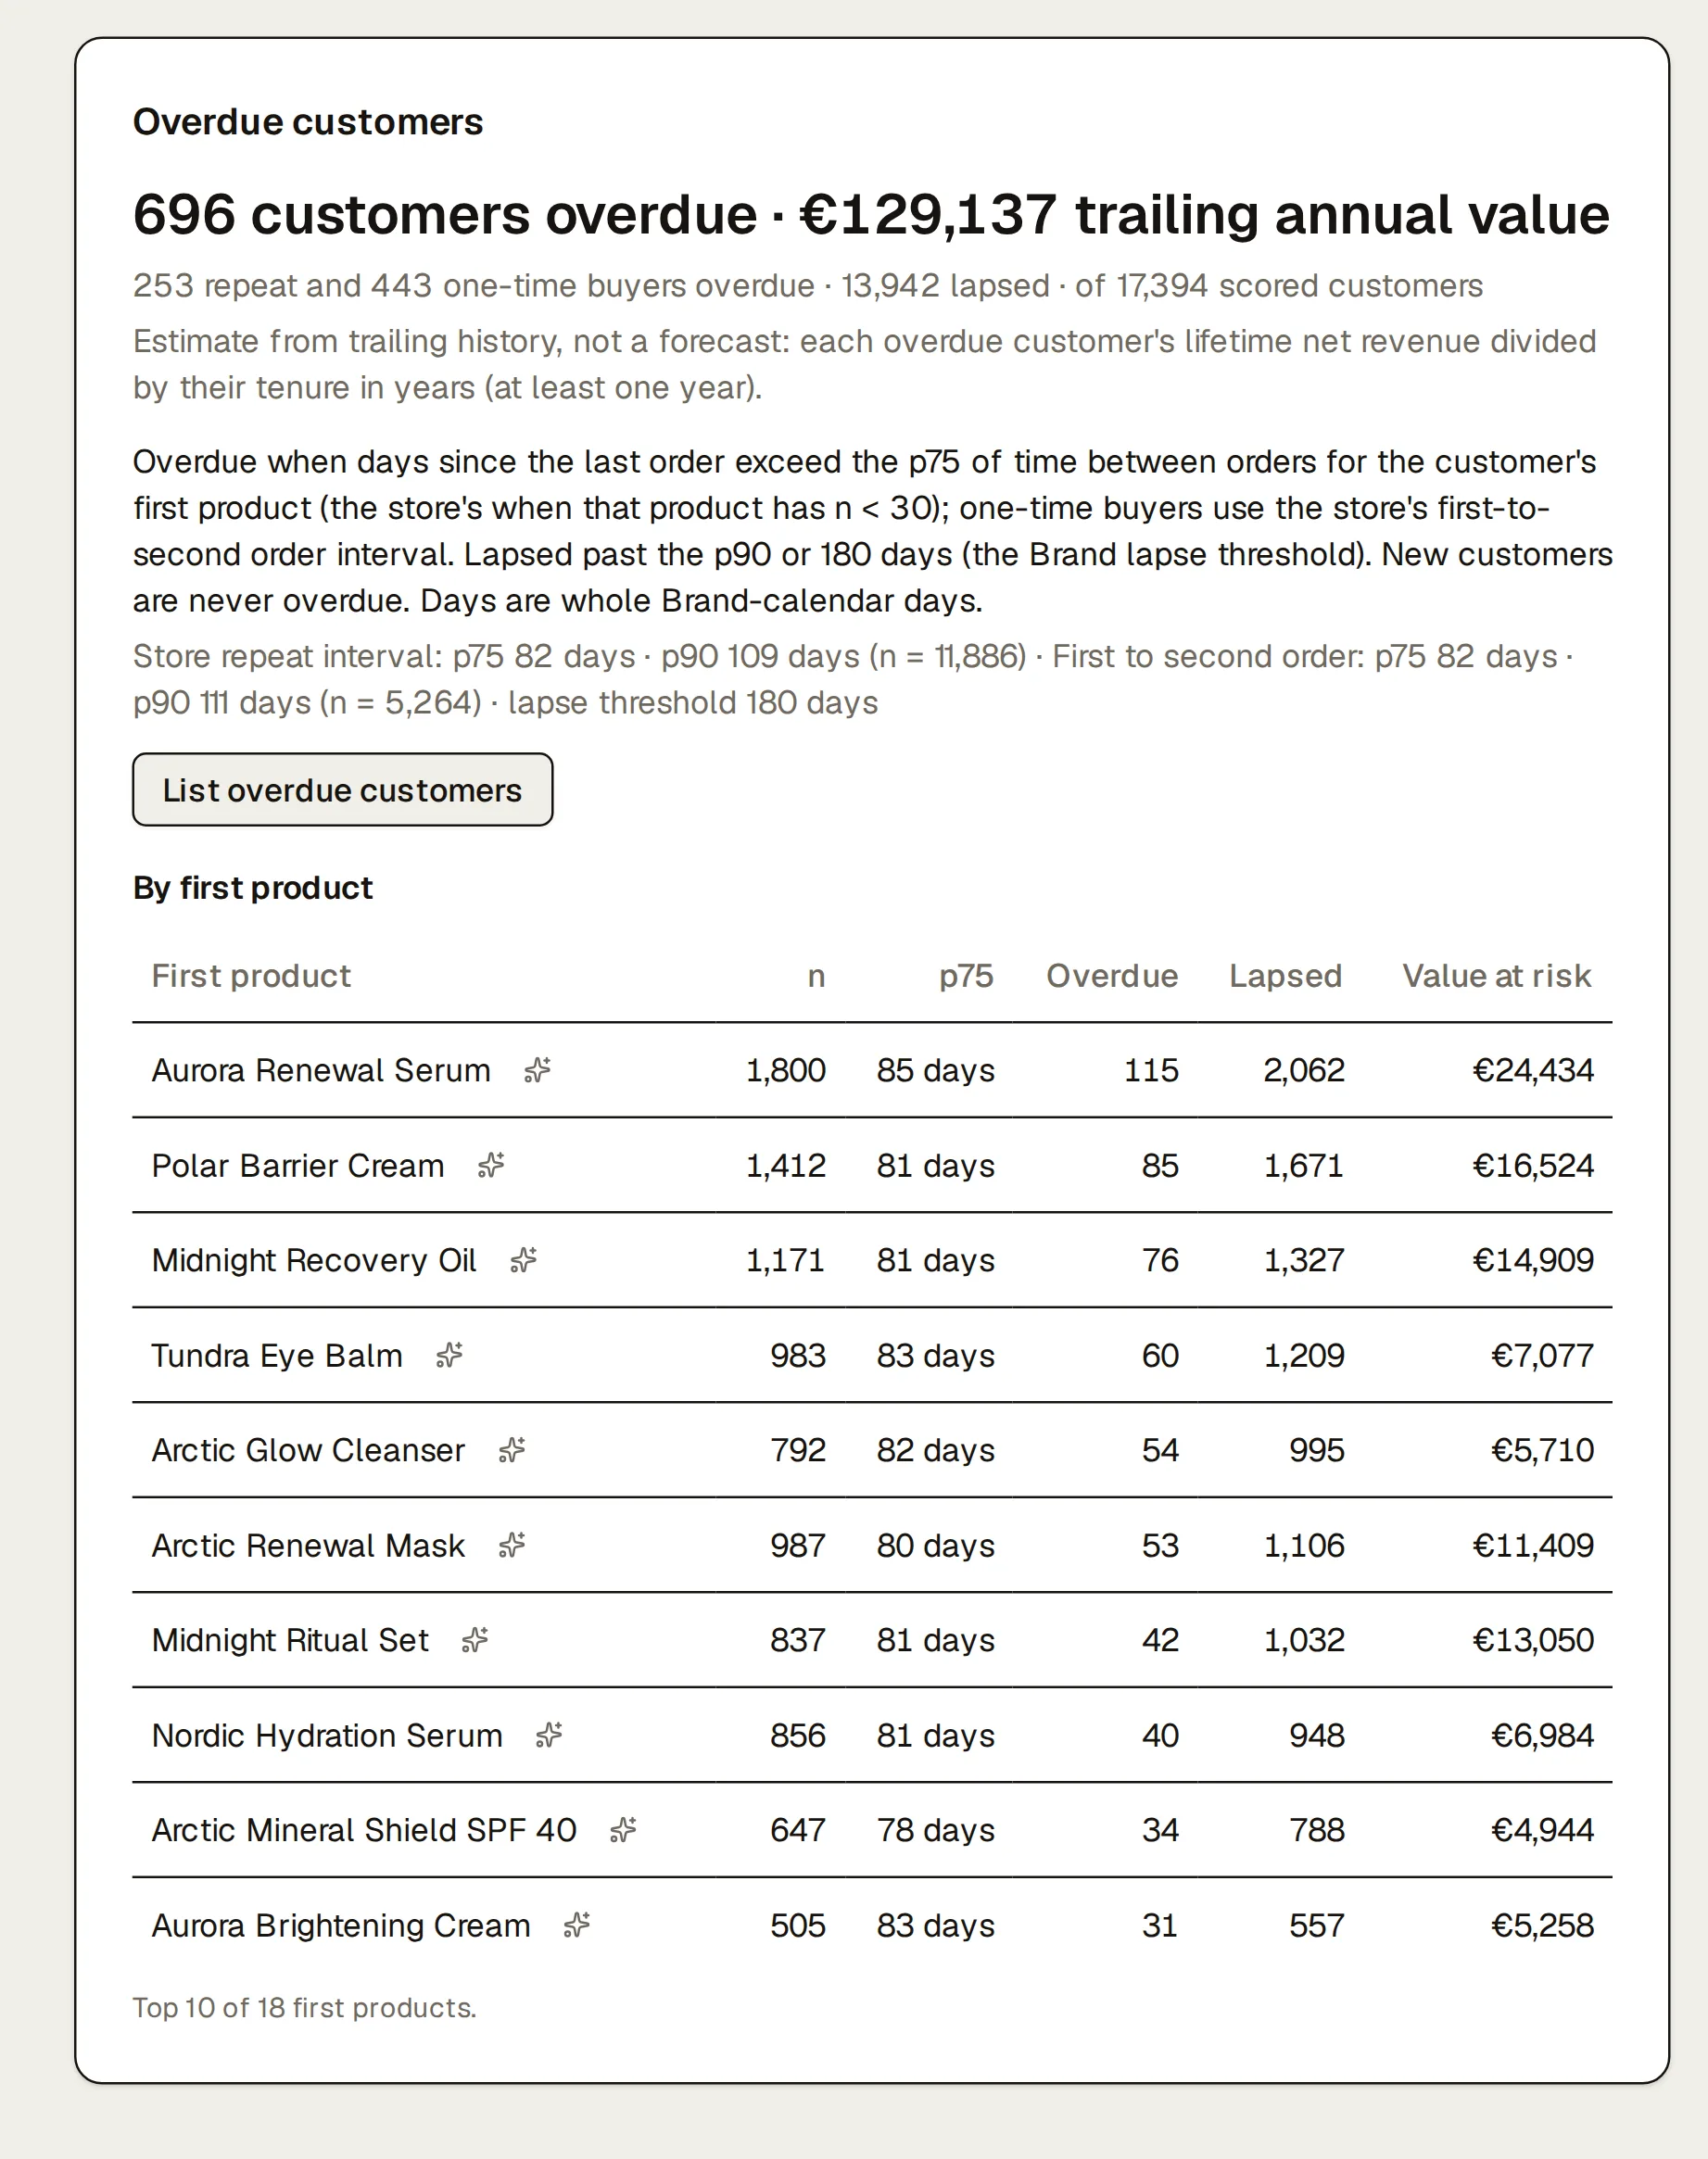
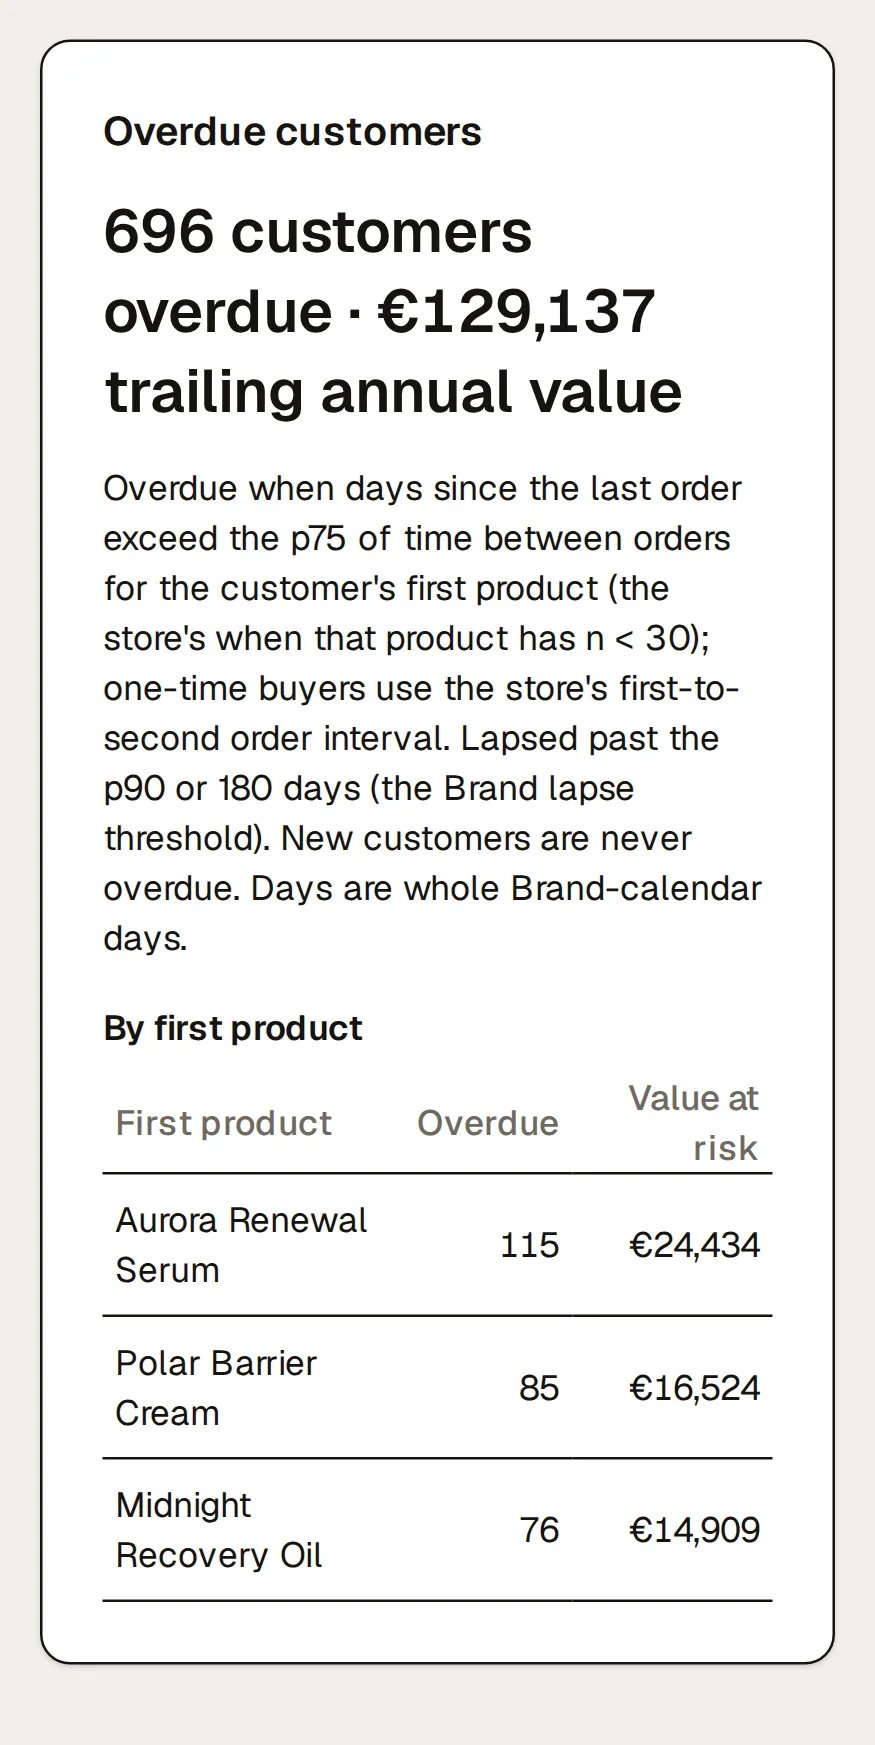
The Overdue customers card on Northlight’s Segments page: “696 customers overdue · €129,137 trailing annual value”, 253 repeat and 443 one-time buyers overdue · 13,942 lapsed · of 17,394 scored customers, the rule that decides who is overdue or lapsed printed in full, and the table by first product (Aurora Renewal Serum (115 overdue), Polar Barrier Cream (85 overdue), Midnight Recovery Oil (76 overdue), and more) with each product’s p75 reorder interval and its overdue and lapsed customers. The Overdue customers card on Northlight’s Segments page: “696 customers overdue · €129,137 trailing annual value”, 253 repeat and 443 one-time buyers overdue · 13,942 lapsed · of 17,394 scored customers, the rule that decides who is overdue or lapsed printed in full, and the table by first product (Aurora Renewal Serum (115 overdue), Polar Barrier Cream (85 overdue), Midnight Recovery Oil (76 overdue), and more) with each product’s p75 reorder interval and its overdue and lapsed customers.
Customers overdue for their next order, and the value at stake. Demo data: Northlight, a fictional brand.

Time to second order, by first product

How many first-time buyers come back, how long the second order takes (median and 75th percentile), and which first products lead to the most repeat buyers. Use it to time the win-back email. Thin samples are greyed out and marked as low sample.
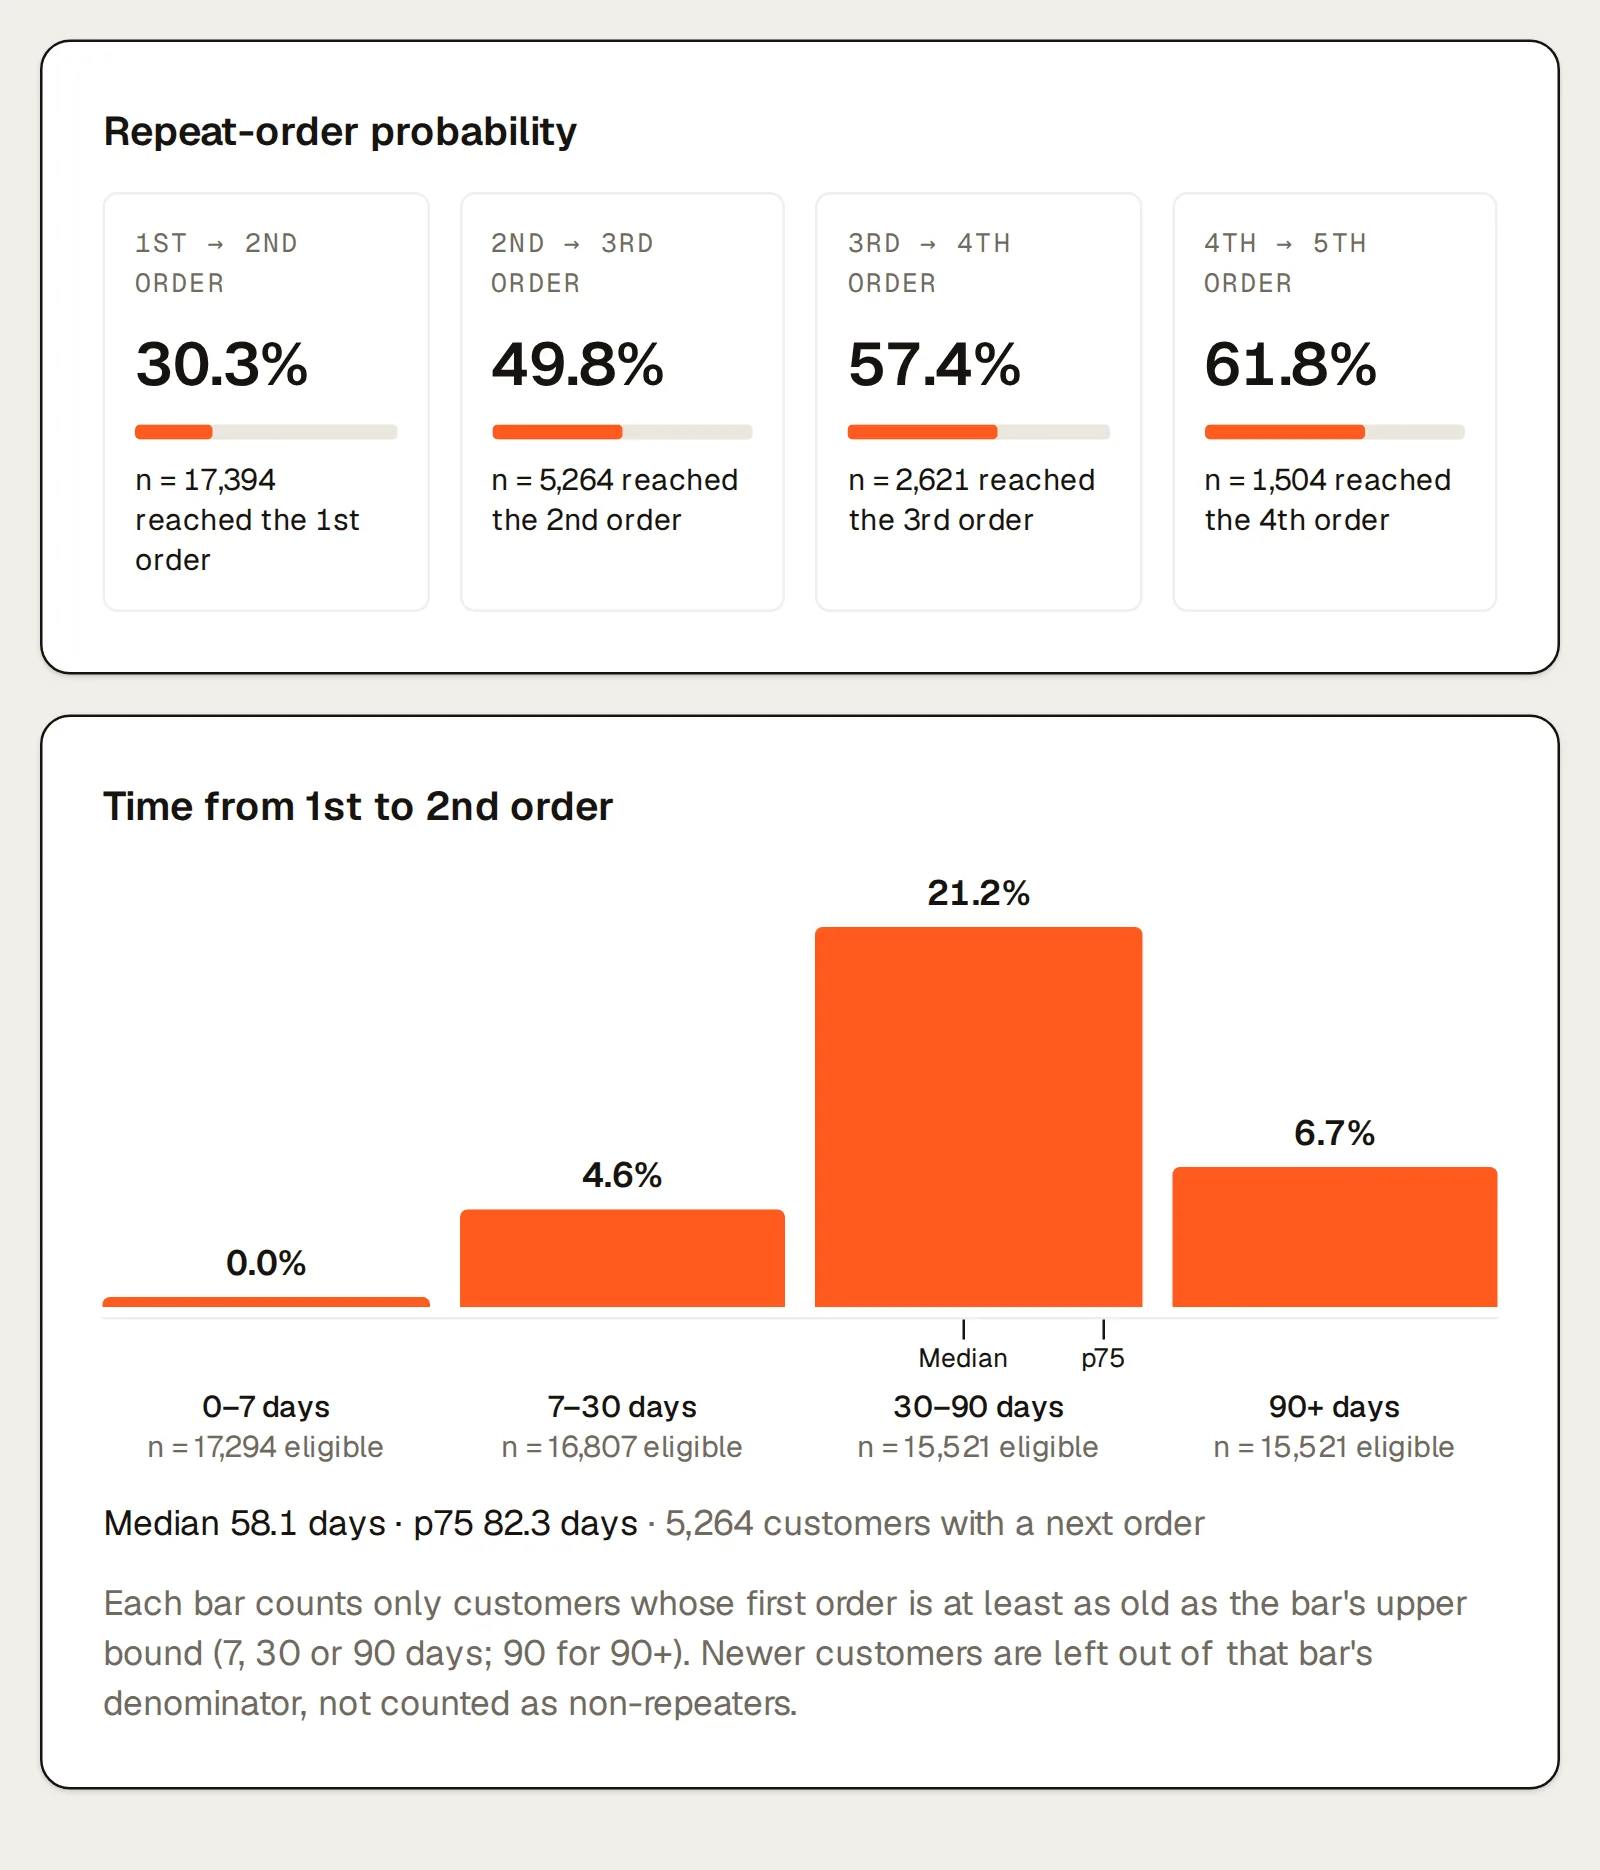
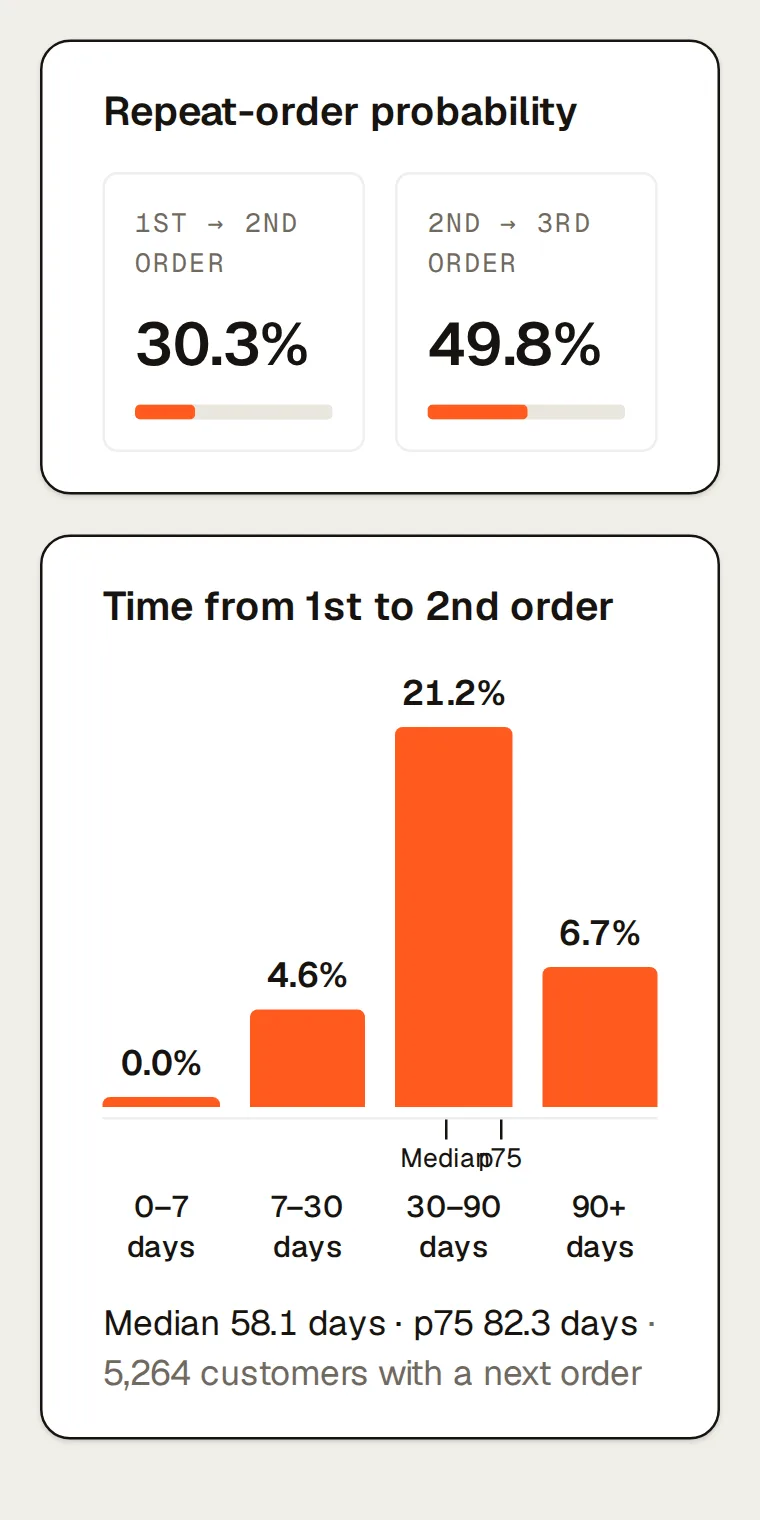
Northlight’s repeat purchases over all history: the repeat-order ladder (1st → 2nd order 30.3%, 2nd → 3rd order 49.8%, 3rd → 4th order 57.4%, 4th → 5th order 61.8%) above the time from first to second order as a histogram (0–7, 7–30, 30–90 and 90+ days) with the median and 75th-percentile markers: Median 58.1 days · p75 82.3 days · 5,264 customers with a next order. Northlight’s repeat purchases over all history: the repeat-order ladder (1st → 2nd order 30.3%, 2nd → 3rd order 49.8%, 3rd → 4th order 57.4%, 4th → 5th order 61.8%) above the time from first to second order as a histogram (0–7, 7–30, 30–90 and 90+ days) with the median and 75th-percentile markers: Median 58.1 days · p75 82.3 days · 5,264 customers with a next order.
Repeat buyers and the time to a second order. Demo data: Northlight, a fictional brand.

Segments you build yourself, and RFM every week

Build your own segments (“bought the serum, no order in 90 days, spent over €200”) and Kreel tracks their size every week. Kreel also scores customers weekly on recency, frequency and spend and sorts them into RFM segments, with the revenue each holds and how customers have moved between segments over the last four or thirteen weeks. Owners and admins can export a segment as a CSV, after confirming they have a lawful basis to use it.

Segments stay in Kreel. Nothing is pushed to Klaviyo or the ad platforms.
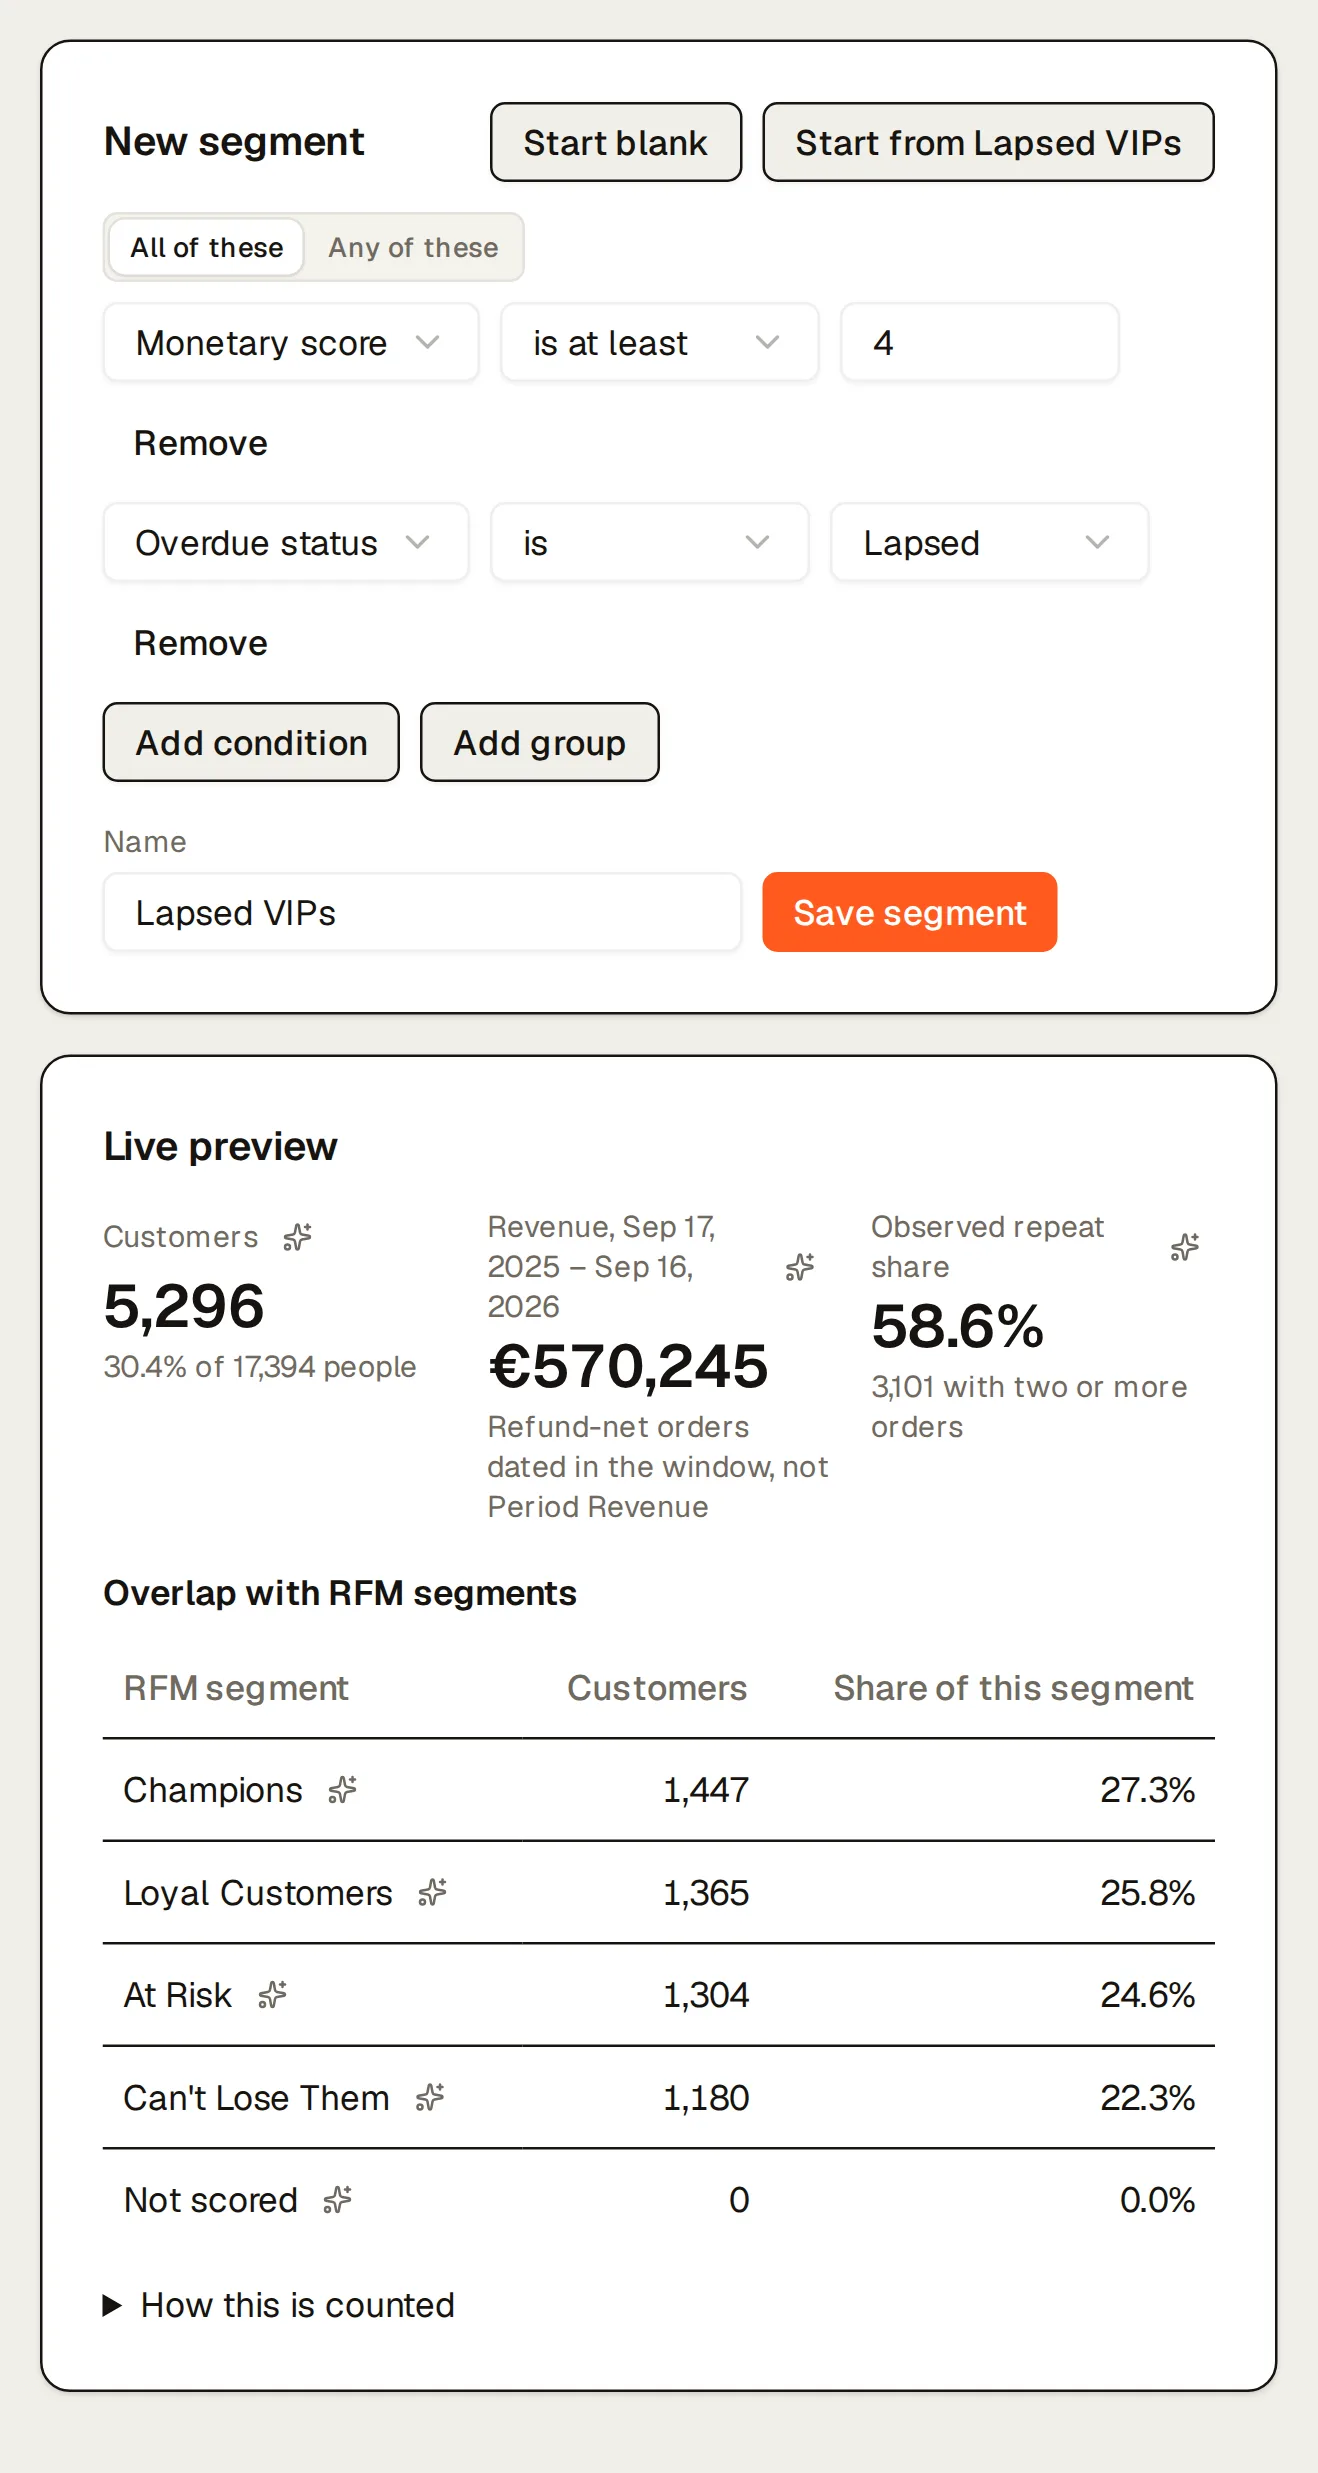
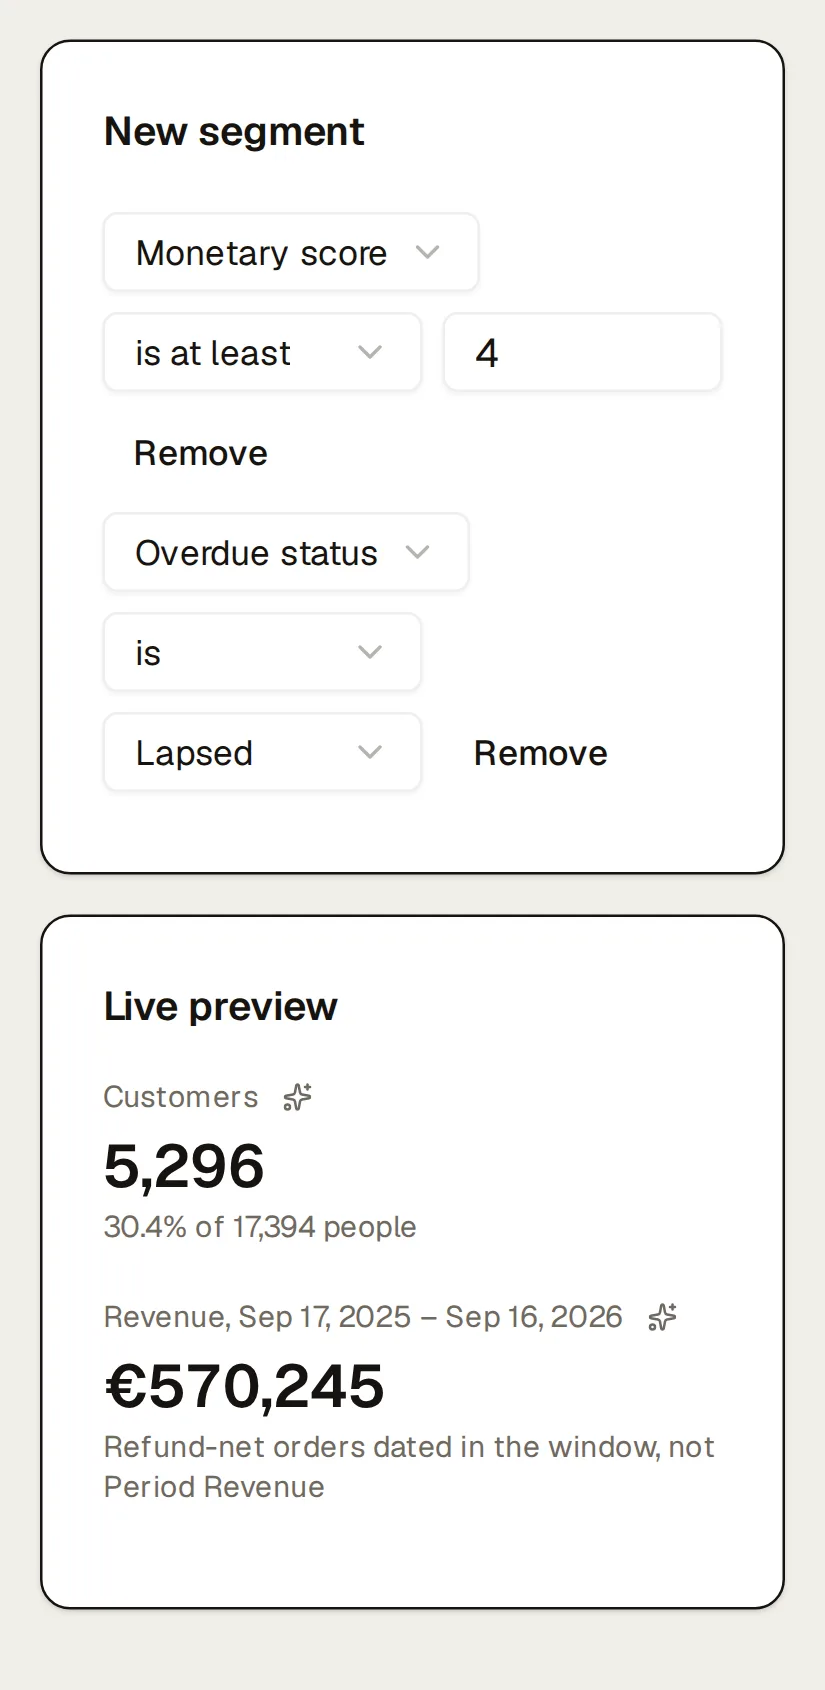
The segment builder on Northlight’s Segments page with a two-condition rule (Monetary score is at least 4 and Overdue status is Lapsed) and its live preview: 5,296 customers (30.4% of 17,394 people), €570,245 of revenue over the last 365 days, and how the segment overlaps the RFM segments. The segment builder on Northlight’s Segments page with a two-condition rule (Monetary score is at least 4 and Overdue status is Lapsed) and its live preview: 5,296 customers (30.4% of 17,394 people), €570,245 of revenue over the last 365 days, and how the segment overlaps the RFM segments.
A segment built from two conditions, with its live preview. Demo data: Northlight, a fictional brand.

Also on this page

New, returning and reactivated.
Store revenue split into new, returning and reactivated customers, in the weekly brief and through your AI. Reactivated means a repeat order after a gap you set (180 days unless you change it).

Ask it in your own AI

Ready-made prompts and the question each answers
PromptThe question it answers
Weekly reportDid last week’s growth come from new customers or existing ones?
Quarterly business reviewHow did the quarter go, including the customer segments?
Monthly board summaryWhat does the board need to know about this month, customers included?
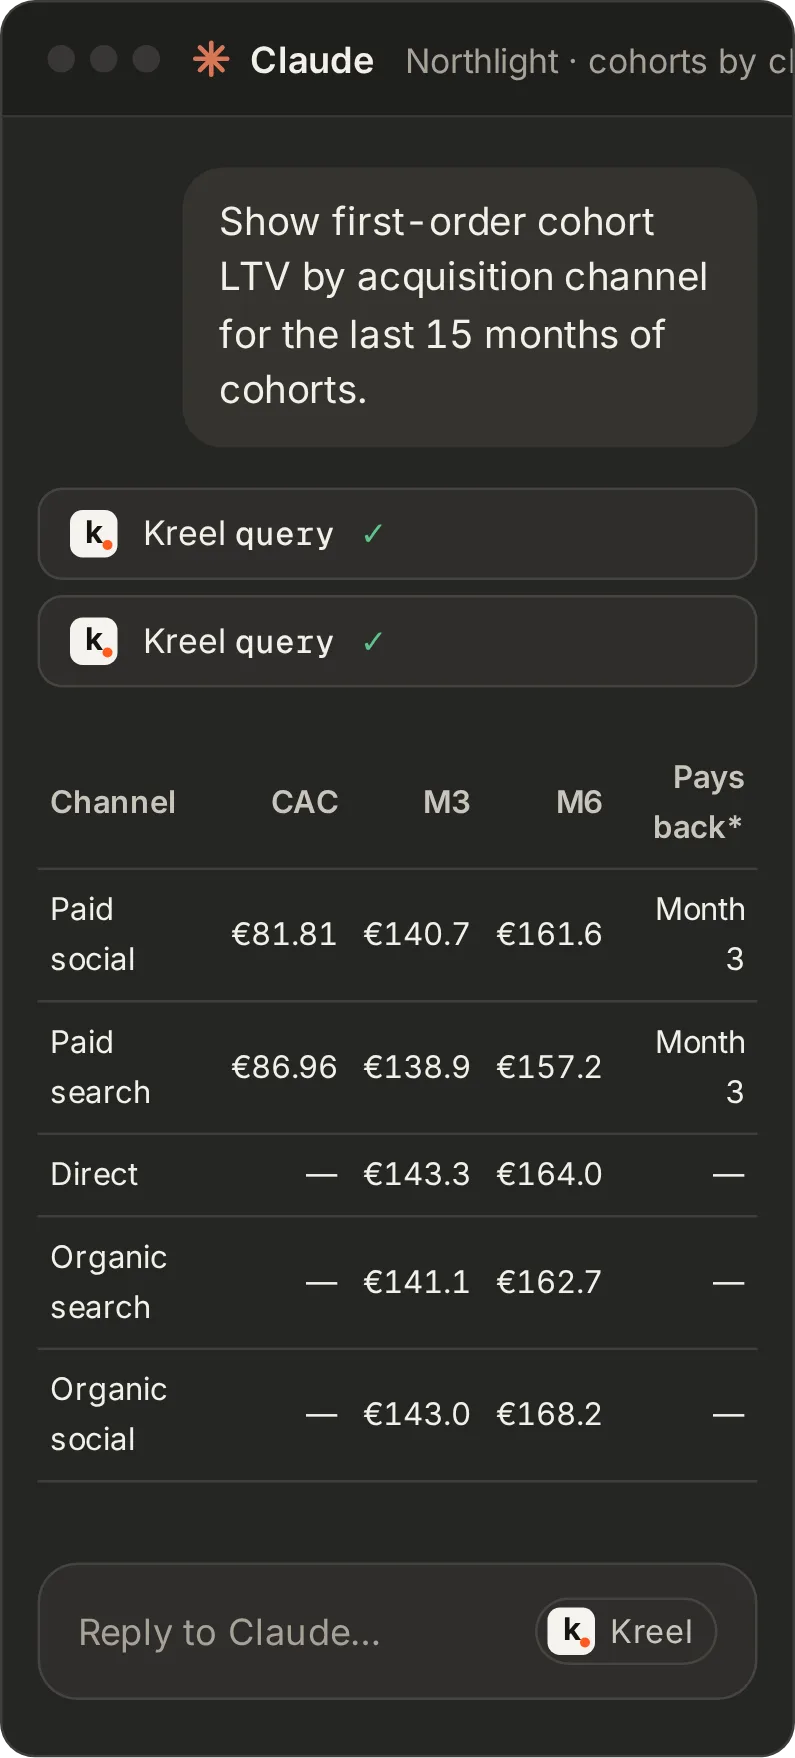
In your own wordsShow first-order cohort LTV by acquisition channel for the last 15 months of cohorts.
In your own wordsHow many lapsed VIPs do we have, and is that group growing?

The free-form questions run on Kreel’s cohort and segment tables through your AI. Your AI gets counts and totals; customer names and emails stay in Kreel.

Every prompt runs in your Claude or ChatGPT. Kreel never writes to your store or ad accounts.
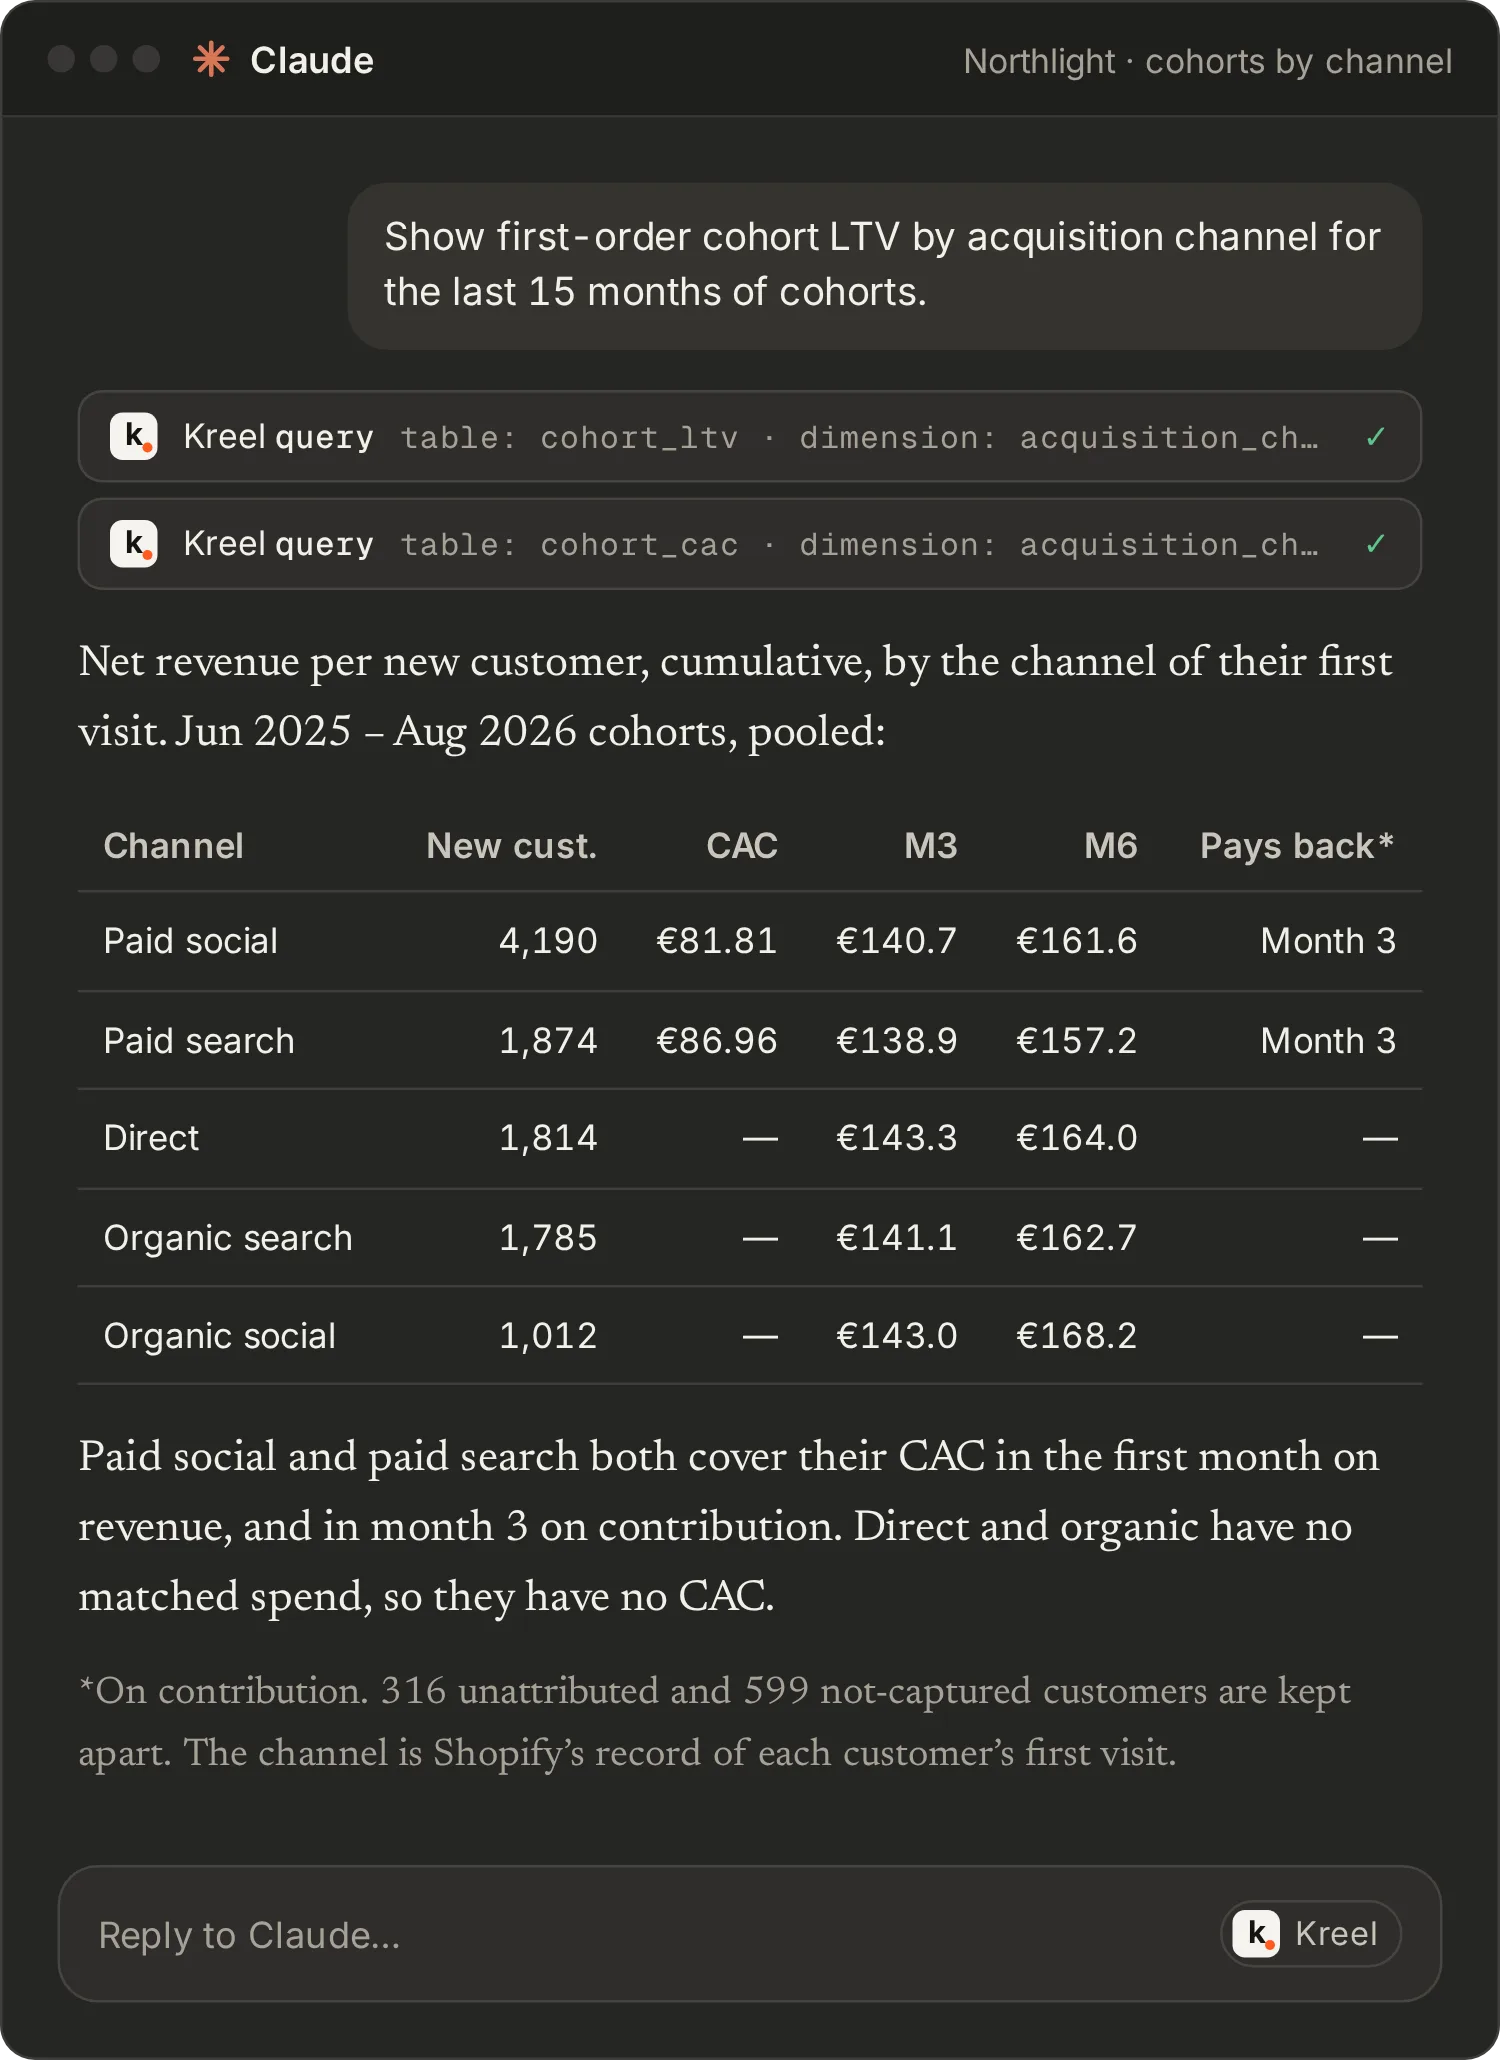
A mock Claude conversation: first-order cohort LTV by acquisition channel, with new customers, CAC, cumulative revenue per customer at months 3 and 6, and the month the paid channels pay back their CAC on contribution. A mock Claude conversation: first-order cohort LTV by acquisition channel, with new customers, CAC, cumulative revenue per customer at months 3 and 6, and the month the paid channels pay back their CAC on contribution.
Cohort LTV by acquisition channel, in your own Claude. Demo data: Northlight, a fictional brand.

What it needs

  • Shopify for everything on this page.
  • Meta, Google Ads or TikTok for CAC, payback and LTV:CAC.
  • Product costs covering at least 80% of revenue for the contribution view.
  • About a year of order history makes cohorts worth reading; Kreel brings in your full Shopify order history.

Questions about Kreel, answered plainly

All questions

Is the acquisition channel an attribution model?

No. It’s Shopify’s own summary of each customer’s first visit, stored with the order. Kreel adds no pixel and no model, and orders synced before Kreel captured the field read “not captured”.

Does customer data reach my AI?

No. Your AI gets counts, totals and segment sizes. Customer names, emails, phone numbers and addresses stay in Kreel.

Can I send a segment to Klaviyo or Meta?

Not from Kreel. Owners and admins can export a segment as a CSV and upload it themselves.

How often do segments update?

RFM scores and overdue flags are recalculated once a week, on Sundays. Saved segments record their size once a week.

Can I export the data?

Kreel has no warehouse sync, and the dashboard’s tables and charts can’t be exported. Owners and admins can export a customer segment as a CSV, after confirming a lawful basis to use it. Your AI and a read-only API can query everything else.

Grow your ecommerce brand from one place.

14 days free. A card is needed to start, and nothing is charged until the trial ends.